
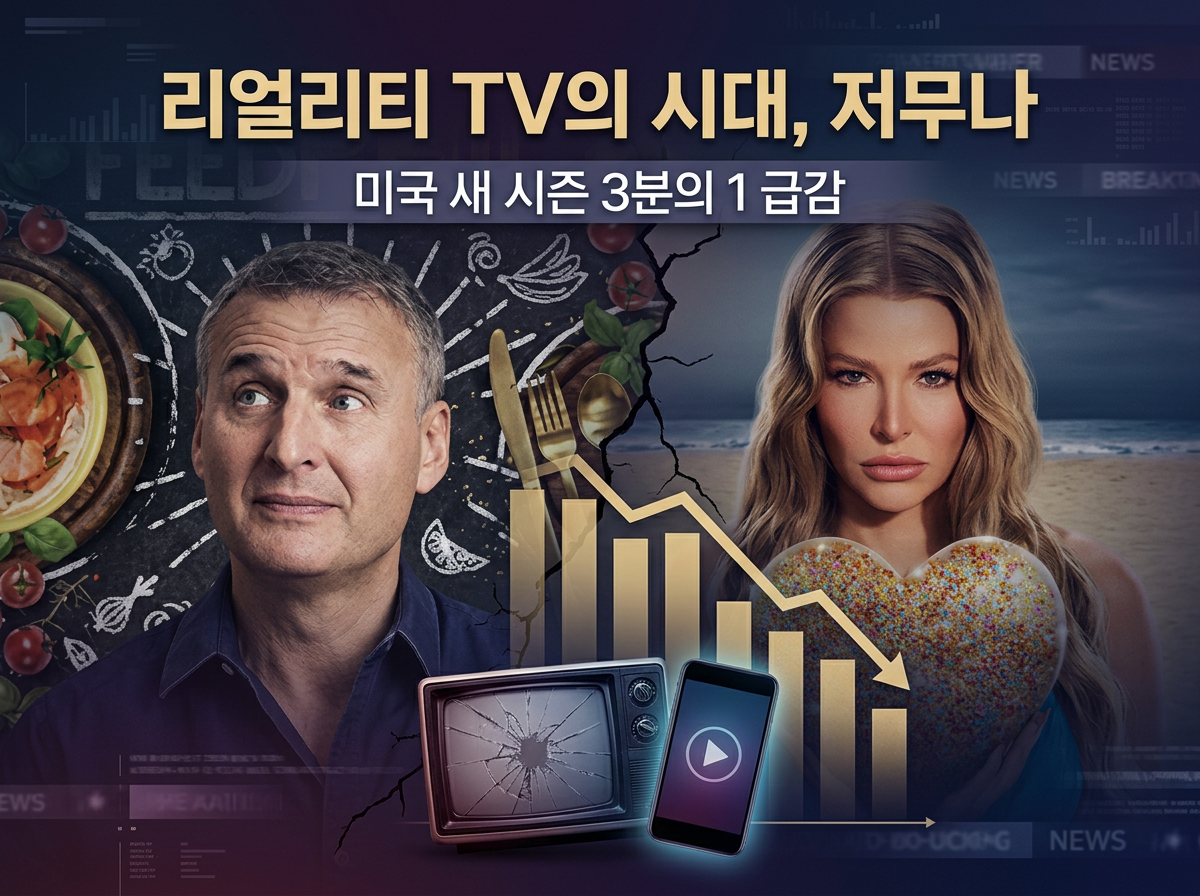
케이블TV 몰락. 유튜브의 부상: 리얼리티 TV, 냉혹한 현실과 마주하다
by
2026년 3월 25일
MEDIA & ENTERTAINMENT • SPECIAL REPORT
BTS, Netflix, and the New Streaming Wars:
How a 45-Month Absence Reshaped a $51 Billion Industry
The world’s biggest boy band sold 2.4 million tickets without playing a note. Netflix is paying $82.7 billion for Warner Bros. Disney just gave OpenAI $1 billion and 250 characters. Live events now claim 15% of all streaming time. And the creator economy hit $254 billion. This is what happens when every rule changes at once.
Sometime in the second week of January 2026, before Bloomberg confirmed the numbers, before the stock moved, before the ticket platforms crashed—someone at HYBE’s headquarters in Yongsan, Seoul, pulled up the pre-sale data for BTS’s comeback tour and saw a figure that didn’t look real: 2.4 million tickets sold across 41 stadium dates in North America, Europe, and the United Kingdom. The group had not performed together in three years and nine months. They had not released music. They had not done a single interview. And 2.4 million people had already paid.
 K-EnterTech Hub
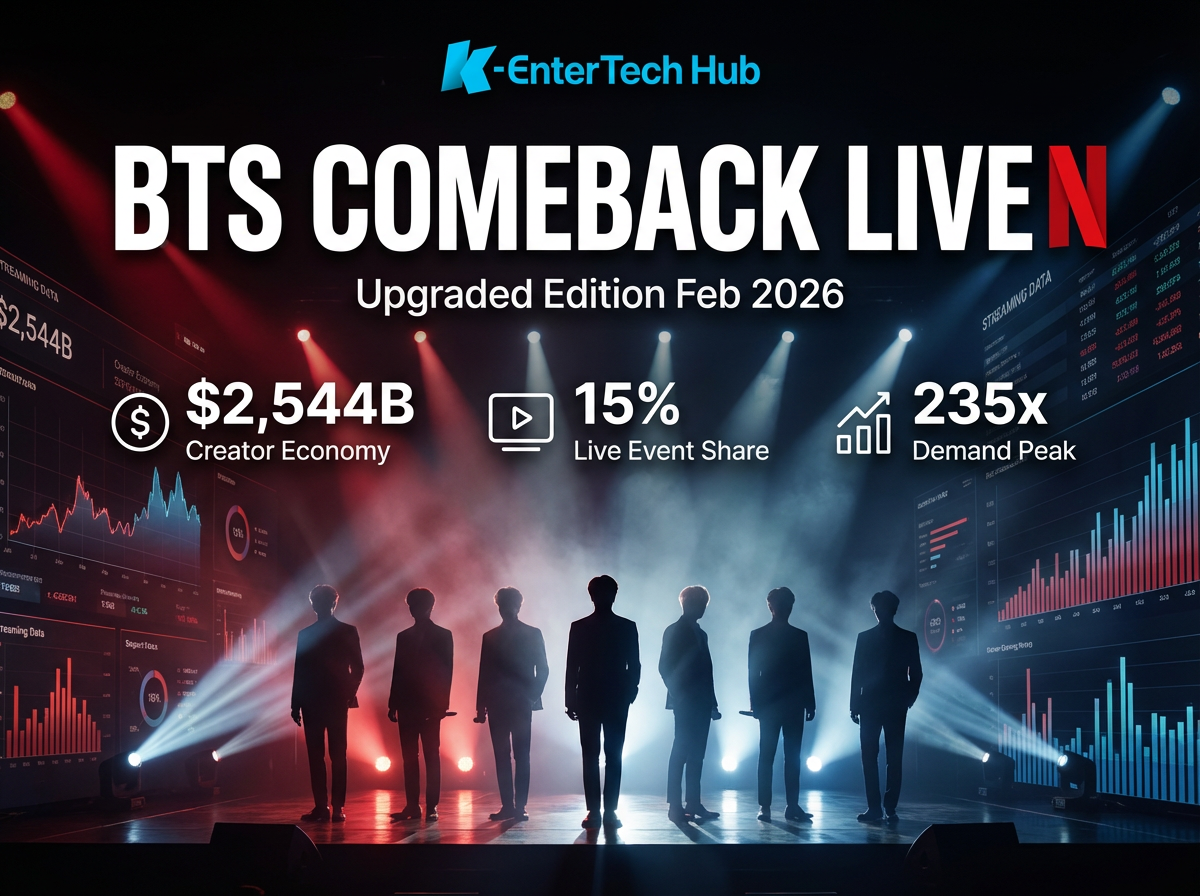
On February 2, Bloomberg’s Sohee Kim and Lucas Shaw published the numbers. HYBE shares, already up 6% year-to-date at ₩368,500, held steady. Netflix, which will exclusively live-stream BTS’s comeback concert from Seoul’s Gwanghwamun Square on March 21, closed at $80.24, up 3.05%. Billboard’s estimate of the total economic value of the comeback: approximately $1.05 billion.
But the BTS comeback is not just a pop culture event. It is a convergence point—the place where every major structural shift in the entertainment industry meets in a single moment. Netflix’s $82.7 billion acquisition of Warner Bros. Discovery. Disney’s $1 billion bet on AI-generated user content. The creator economy’s explosion to $254 billion. The rise of live events to 15% of all streaming time. The end of the subscriber-count era. All of it, intersecting on a single stage in central Seoul.
This is a story about what the entertainment industry looks like when every rule changes at once.

Netflix — BTS: THE RETURN, arriving March 27. A documentary capturing the band recording ARIRANG in Los Angeles.
The hiatus was not accidental. After announcing their group pause in June 2022, all seven members completed mandatory military service. The final two—Jimin and Jungkook—were discharged in June 2025. HYBE treated the 45-month absence as what analysts now call a “planned scarcity” strategy: maximizing brand value through deliberate withdrawal in a market drowning in content.
The data supports the thesis. Parrot Analytics’ DEMAND360 platform, which tracks audience demand across social, search, and engagement signals, shows BTS maintained baseline demand of 100–140× the market average throughout 2025—while doing nothing. During the HYYH 10th Anniversary in March 2025, demand spiked to approximately 235×. For context: MrBeast peaked at 203× during his TikTok acquisition. Stray Kids hit 180× for their KARMA album. Enhypen reached 140× at Coachella. BTS, absent, exceeded all of them.

Parrot Analytics DEMAND360 — Weekly talent demand, 2025. BTS sustained the highest demand despite a three-year hiatus.
Three weeks before the Bloomberg report, on January 24, free solo climber Alex Honnold scaled the exterior of Taipei 101—508 meters, 101 floors—without ropes, safety nets, or the possibility of a second take. Netflix broadcast it live. He completed the climb in 1 hour, 31 minutes, and 34 seconds. The event drew 6.2 million viewers over the opening weekend, making it the No. 3 program across all TV that week.

Netflix — Skyscraper Live: Alex Honnold’s free solo ascent of Taipei 101, January 24, 2026.
The strategic significance was not the viewership number. It was the model. The event was co-organized with the Taiwanese government and the Taipei Film Commission—establishing a template for national-landmark partnerships that Netflix could replicate across Asia. Honnold was paid in the “mid-six figures,” making it one of the highest-ROI live events in streaming history.
The Live Events Performance Arc
The trajectory—Taipei 101 (Taiwan, January), Gwanghwamun Square (Korea, March), WBC (Japan, 2026)—reveals a deliberate Netflix strategy: converting iconic Asian landmarks and cultural moments into global streaming events, with government co-sponsorship as a scaling mechanism.
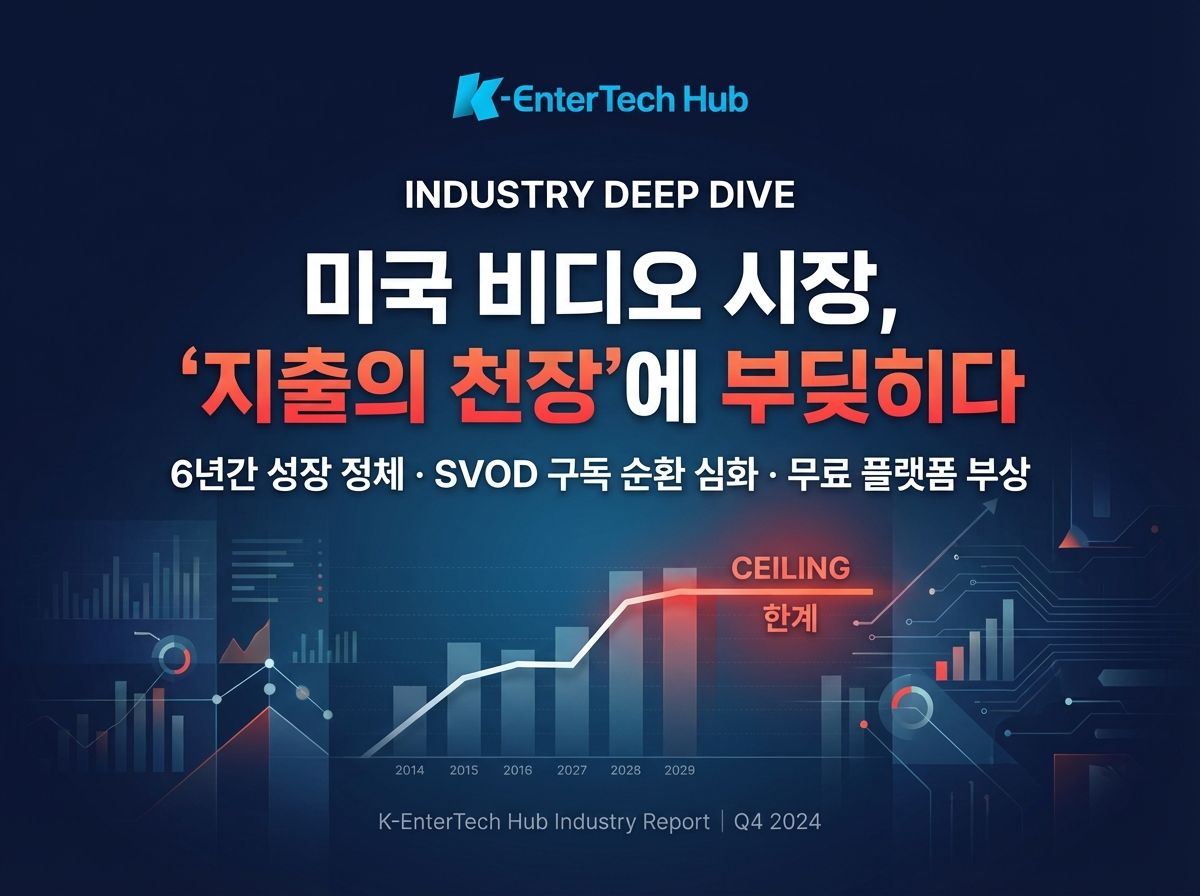
The 15% Factor
The Simon-Kucher Global Streaming Study 2025, surveying 12,326 respondents across key markets, produced a finding that reframes the competitive landscape: live events now account for approximately 15% of the average consumer’s weekly streaming time. Five years ago, the figure was near zero.

Simon-Kucher — Global Streaming Study 2025 (N=12,326). Live events’ share of streaming consumption.

Simon-Kucher 2025 — Weekly global streaming time, by content type.
The non-sports live category—at just 2%—is where BTS sits, and where the growth ceiling is highest. Skyscraper Live proved the category with extreme sports. The BTS comeback expands it to cultural events—a far larger addressable market. Netflix’s 2026 ad revenue target is approximately $3 billion, double 2025. Live events like the BTS concert create premium ad inventory moments at a fraction of scripted-series costs.
The $82.7 Billion Deal
Netflix: Q4 2025 and Q1 2026 Guidance
The margin jump—from 24.5% in Q4 2025 to a 32.1% Q1 2026 guidance—is the number that matters most. BTS’s comeback falls squarely in Q1 2026. Live events generate disproportionate subscriber acquisition and ad revenue at low marginal cost. Netflix also disclosed 96 billion viewing hours in H2 2025, original content up 9%, and the beginning of AI-powered advertising tool tests.
The Disney Question
The strategic divergence is now irreversible. Netflix is pursuing horizontal consolidation: buy the library, own the live rights, scale the subscriber base. Disney is pursuing vertical integration: generate AI content from owned IP, monetize through theme parks, build an attention flywheel from park to screen to UGC and back.
Both have stopped reporting subscriber counts. The era of subscriber-count competition is over. The new metrics: profitability (Netflix margin 31.5% vs. Disney 10%), ad revenue ($3 billion target), and engagement time (96 billion hours). This changes how K-content’s value is assessed—it’s no longer about driving subscriber growth, but generating premium engagement and ad inventory.
Disney’s $1 billion Sora partnership—250+ characters, three-year exclusive, no human faces, animation only—is the first time a legacy studio has treated user-generated content as a product line rather than a piracy risk. Bob Iger was explicit: this is Disney’s YouTube strategy. Disney Experiences, meanwhile, topped $10 billion for the first time, though domestic parks grew just 1% ahead of Universal’s Epic Universe opening.
Three platforms, three creator strategies. Disney: open the IP vault to AI-powered UGC. Netflix: sign podcast deals and fill the content pipeline with creator-driven formats at a fraction of scripted costs. HYBE: turn the world’s most organized fandom into a vertically integrated content-commerce-community ecosystem.
The convergence is real. BTS’s ARMY represents precisely the kind of organized, self-sustaining content machine that Disney is spending $1 billion to build synthetically. Album campaigns, streaming coordination, multilingual translation, fan art, video production, hashtag engineering—all unpaid, all amplifying IP value. As the creator economy scales from $254 billion to $1.35 trillion, K-pop’s fandom structure becomes an increasingly powerful competitive moat.
The HYBE 2.0 model—“scarcity-based integrated experience”—treated 45 months of absence not as a disruption but as deliberate brand strategy. In a market where 207 million creators compete for attention, scarcity is the most powerful marketing tool available. iM Securities projects operating profit of ₩514.9 billion (+622%); Yuanta Securities estimates BTS IP alone adds over ₩1 trillion in incremental revenue.
The tension at the center of HYBE’s strategy is the one facing the entire K-content industry: the BTS comeback is a Netflix exclusive, solidifying platform dependency—while Weverse’s owned ecosystem represents the autonomy alternative. Global reach versus data ownership. Distribution scale versus direct fan relationships. This is not just HYBE’s dilemma. It is K-pop’s.
1. The Attention Economy Has Arrived
Parrot Analytics’ thesis—supply-constrained to attention-constrained—is no longer theory. Success is determined by sustained demand, cross-border travelability, and fandom-driven structural engagement, not by volume of output. BTS is the textbook case: zero output for 45 months, highest demand globally.
2. Live Events Are the New Subscriber Gateway
At 15% of streaming time with disproportionate acquisition impact (NFL: 430K signups, 45% retention), live events have evolved from experiments into strategic pillars. Netflix hit a record 9.0% U.S. TV share in December, driven partly by live programming. The BTS comeback tests whether non-sports cultural events can match sports in subscriber conversion.
3. The Subscriber-Count Era Is Over
Both Netflix (325M) and Disney (196M) have stopped reporting. The new battleground: profitability, ad revenue, engagement time. This fundamentally changes how K-content’s value is assessed.
4. Super-Consolidation Reshapes K-Content’s Position
The Netflix-WBD merger creates a ~30.7% U.S. streaming share with HBO, DC, and Warner Bros. integrated. K-content gains broader exposure but faces intensified internal competition. Korean drama production is already down 24% from its 2022 peak. BTS’s multi-format approach—live event, documentary, album, tour, merchandise—offers a model for maintaining position.
5. Platform Dependency vs. Creator Autonomy
BTS’s Netflix-exclusive comeback versus HYBE’s Weverse ecosystem is the defining tension. As the creator economy scales to $1.35 trillion, whether K-content builds its own platforms or rents Western ones will determine its structural power in the global entertainment hierarchy.
The Numbers
What happens on March 21, 2026, in Gwanghwamun Square will not be a concert. It will be a referendum—on whether live streaming justifies the billions invested in it, on whether fandom economics can scale beyond music, on whether platform consolidation leaves room for non-Western IP, and on whether the attention economy rewards patience over volume.
BTS, as they have done before, will be the test case. The industry will be watching. So will Wall Street.
■ Sources
Netflix Q4 2025 Shareholder Letter (Jan. 20, 2026); Disney FY2026 Q1 Earnings (Feb. 2, 2026); Bloomberg (Sohee Kim, Lucas Shaw, Feb. 2, 2026); Parrot Analytics DEMAND360 & 2025 Annual Report; Simon-Kucher Global Streaming Study 2025 (N=12,326); Billboard; iM Securities; Yuanta Securities; Daishin Securities; Grand View Research; Goldman Sachs; SNS Insider; Zacks Investment Research.

![[SXSW2026] ‘수렴(Convergence)’의 시대, K-엔터테크를 덮칠 세 폭풍](https://cdn.media.bluedot.so/bluedot.kentertechhub/2026/03/pg648c_202603152304.png)
![[투비]The Stream 2026: When Intention Becomes Attention](https://cdn.media.bluedot.so/bluedot.kentertechhub/2026/03/6h3xe4_202603220154.png)
![[SXSW2026]에이미 웹 트렌드 리포트(Convergence
Outlook 2026)](https://cdn.media.bluedot.so/bluedot.kentertechhub/2026/03/kty3s8_202603152312.png)

![[보고서]전통 언론사의 크리에이터 전략 대전환](https://cdn.media.bluedot.so/bluedot.kentertechhub/2026/02/0nwc9z_202602100212.png)