
Amazon Channels takes 67% of US specialty gross adds, and with subscription pricing closed and advertising heading toward 54% of subscription revenue, the weight of a contract moves from commission to ad inventory
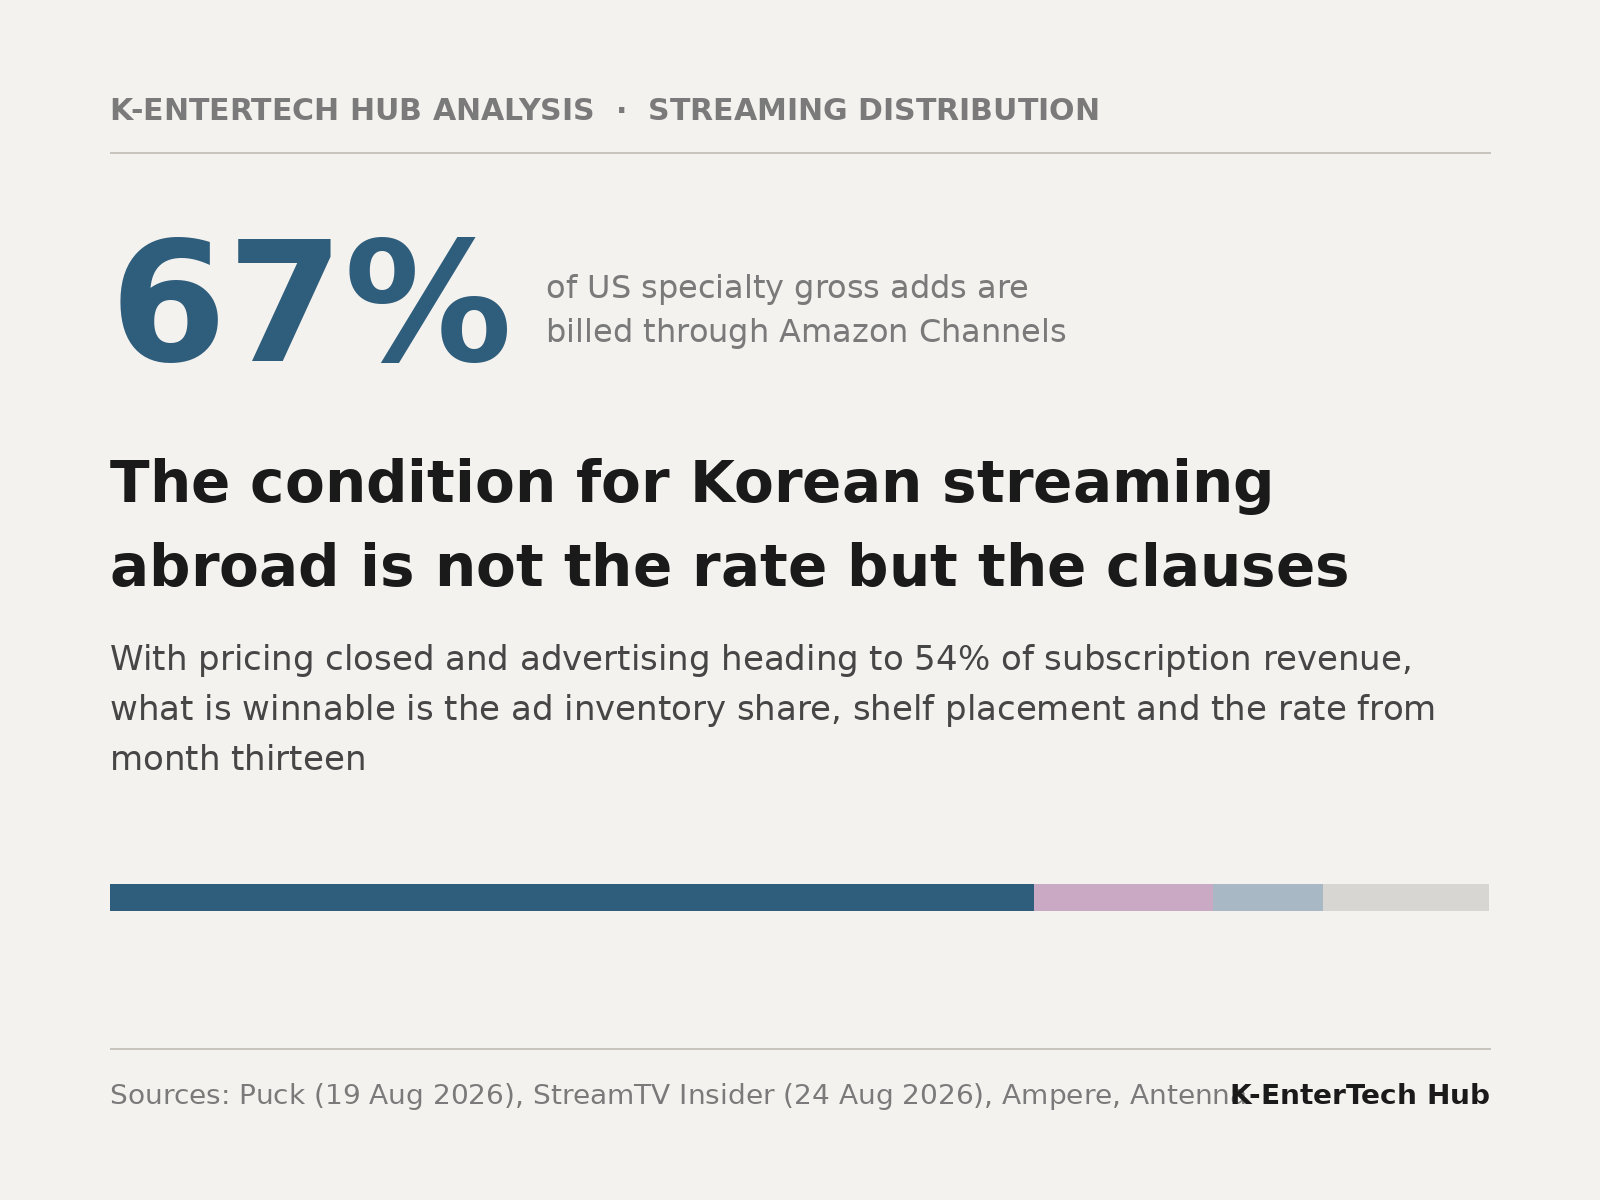
Seven in ten new subscriptions to specialty streaming services in the United States go through Amazon. In Antenna's Q2 2026 figures, Amazon Channels accounted for 67% of Specialty SVOD gross adds by route, against 13% for The Roku Channel and 8% for iTunes. The gap over second place is 54 points — more than double the 26-point margin by which Amazon leads Shopify in US e-commerce.
Prime Video has changed character. It has moved from a service selling its own originals to a shelf that sells other companies' services, and Prime Video Channels is the mechanism. Eleven years after launching in 2015 as the Streaming Partners Program, it has become close to the single distribution route for US specialty streaming.
The take follows retail grammar. Amazon keeps 15% to 30% of subscription revenue for the first twelve months depending on the partner, and takes a share of the advertising time the service sells. Applied to the $7.99 a month KOCOWA+ charges, what remains to the operator is $5.59 to $6.79 per subscription over the first year. A service running an ad tier gives up a further share of inventory from there.
Those paying the toll have their own arithmetic. Services with thin marketing budgets — BritBox, Acorn TV — attach to a subscriber base of a scale they could not otherwise reach, and one with low churn. An adjacency effect follows: about 20% of customers who sign up to one service through Channels buy a second within six months. Being on the shelf itself generates cross-selling. Puck's Julia Alexander wrote on 19 August that Amazon is running the same play in streaming that it runs in e-commerce — laying out services the way it lays out products.
The problem is that the room to recover that commission through price increases has gone. In analysis published by Ampere Analysis on 24 August, average price increases across Netflix, Disney+ and Amazon Prime Video fell from 24% in 2023-2024 to 14% in 2025-2026, with the average increase falling from $1.67 to $1.54. Ampere reads that as approaching the limit of what consumers can pay.
When subscription price closes, advertising is the revenue that remains. Ampere expects North American ad-tier revenue to exceed $45 billion this year and to reach 54% of the region's subscription streaming revenue by the end of 2026 — 3.7 times the $12.2 billion of 2022.
Where those two currents meet is the subject of this article. The contract term a service joining Channels should be fighting over is not the subscription split. The 15-30% band is already known and leaves little room. The ad inventory share, by contrast, varies in both ratio and selling party from contract to contract, and its weight grows at the same pace as advertising passing half of subscription revenue. That is where Korean operators and broadcasters weighing a place on this shelf should be looking. What the weaker party in a negotiation can secure is not the rate but the clauses.
What specialty streaming is: 31 services that gave up general programming for a single taste
Antenna defines Specialty SVOD as the smaller paid services that target specific audiences with narrower programming strategies, and tracks 31 of them. The comparison set of ten premium services comprises Netflix, Disney+, HBO Max, Hulu, Paramount+, Peacock, Apple TV, Discovery+, Starz and FOX One.
What separates the two is breadth of programming rather than size. Premium layers large original investment on general programming across every genre and age group — the promise being that there is something here to watch. Specialty goes the other way: it picks one genre or one community and curates a library inside it. The condition of the category is that the answer to why a viewer subscribes fits in a single sentence.
On the Prime Video Channels storefront that distinction disappears. Premium services such as Paramount+, HBO Max, STARZ, Showtime and discovery+ sit on the same shelf as specialty services including AMC+, BritBox, PBS KIDS and Shudder. At the distribution layer, a general-entertainment operator and a single-taste operator are handled as the same unit of merchandise.

The Prime Video Channels storefront, where premium and specialty services share a shelf. Screenshot: Prime Video Channels
Grouping the 31 services by character shows what the category actually sells.

Composition of the 31 tracked Specialty SVOD services by programming character. The grouping is the author's, based on each service's programming, and is not a classification from the source report. Source: Antenna appendix listing
— Regional drama archives — BritBox, Acorn TV, BBC Select and MHz Choice sell British and European drama. All four rest on international distribution of existing broadcast archives rather than new production.
— Genre specialists — Crunchyroll and HIDIVE for Japanese anime, Shudder for horror, MUBI and Sundance Now for arthouse film.
— Public and educational — PBS Masterpiece, PBS Documentaries, PBS KIDS and CuriosityStream.
— Nonfiction archives — A&E Crime Central and History Vault, which move a cable channel's accumulated output directly into a subscription product.
— Faith and family — PureFlix, UP Faith & Family and Hallmark+.
— Community-based — BET+ and ALLBLK target Black audiences; Fox Nation targets conservative news viewers.
The price band runs from $3 to $9
Specialty subscriptions are priced below premium. The cheapest is Roku's Howdy, launched on 5 August 2025 at $2.99 a month with roughly 10,000 hours of library and no advertising, licensed from Lionsgate, Warner Bros. Discovery and FilmRise alongside select Roku Originals.
Roku founder Anthony Wood said at launch that Howdy was designed to complement premium services rather than compete with them. At CES in January 2026 he said the company would widen distribution beyond Roku devices.
The most expensive specialty service is The Wonder Project. The faith-based family platform launched on 5 October 2025 inside Prime Video Channels alone, at $8.99 a month or $89.99 a year, with more than 1,000 hours of curated library and the season two premiere of House of David released first.
The price gap between the two reflects a difference in strategy. Howdy attached library volume to the lowest price to become a complement to premium; The Wonder Project attached an original premiere to justify triple the rate.
KOCOWA+, the Korean-content specialty service built by Korea's three terrestrial broadcasters, is also carried on Amazon Channels, at $7.99 a month. That is high within the specialty band — particularly for a library service without original premieres — and the 15-30% Channels commission sits inside it.

The KOCOWA+ lineup, bundling drama and entertainment from Korea's three terrestrial broadcasters at $7.99 a month. Image: KOCOWA+
15-30% of subscription revenue in the first 12 months, with ad inventory also in the split
Deducting the commission from KOCOWA+'s $7.99 leaves the operator roughly $5.59 to $6.79 per subscription over the first twelve months. A service running an ad tier gives up a further share of inventory from there.

Split on one $7.99 monthly subscription at each end of the commission range. Rates vary by partner, and the advertising inventory share is separate. Calculated from rates reported by Puck
It is a substantial sum, and specialty services accept it for a reason. KOCOWA+, BritBox and Acorn TV alike reach through Amazon an audience their own marketing could not. Prime Channels users skew toward heavy streaming consumption, which means attaching to a low-churn base. Among recent US entrants, some have launched inside Channels and nowhere else.
The same structure as Bezos's 2014 shareholder letter: 40% of e-commerce against 67% of Channels
Jeff Bezos described Amazon's flywheel in his 2014 letter to shareholders — a cycle of consumption that only began turning once third-party products sat next to Amazon's own. More sellers attract more buyers, and more buyers bring in more sellers.
Amazon now holds close to 40% of the US e-commerce market, with Shopify second at 14% and Walmart, its closest traditional retail competitor, just over 6%. On the streaming distribution side, Antenna's Q2 2026 figures put Amazon Channels at 67%, The Roku Channel at 13% and iTunes at 8%.

Amazon's share of US e-commerce and of Specialty SVOD gross adds by route. E-commerce figures as cited by Puck; gross adds as of Q2 2026. Sources: Puck, Antenna
Amazon's position is stronger in streaming distribution than in e-commerce. Its margin over second place is 26 points in e-commerce and 54 points in specialty gross adds.
Price increases fell from 24% to 14%, averaging $1.60 per hike over three years
The three largest streaming services are Netflix, Disney+ and Amazon Prime Video. Ampere puts their average increase over three years at $1.60, equivalent to 17% of the previous price — but the strategies differ. Netflix's increases stayed broadly stable, Disney+ showed the clearest move toward smaller increases, and Amazon Prime Video raised prices least often, which Ampere attributes to the role a Prime subscription plays across the wider retail business.

Average price increase and average dollar increase per hike across Netflix, Disney+ and Amazon Prime Video. Source: Ampere Analysis
Consumer price sensitivity is rising. Hub Entertainment Research also found consumers increasingly leading with price when judging the value of a streaming service. Ampere senior research manager Jaanika Juntson attributed both the smaller increases and the widening gap between tiers to diversification in monetisation: advertising reduces reliance on subscription pricing, while password-sharing crackdowns extract extra member fees from existing users.
The ad-free premium widened from $4.53 to $5.35, and to $11 at Netflix in the US
Increases landed unevenly across tiers. Over three years, ad-free tiers rose by an average of $1.62 against $1.21 for ad-supported tiers. Most services are keeping the ad tier cheap in order to grow its subscriber base.
Globally across the three, the monthly gap between the two tiers widened from $4.53 in August 2023-July 2024 to $5.35 in August 2025-July 2026. At Netflix in the US, the difference between Standard with Ads and ad-free Standard for new subscribers grew from $8.50 in August 2023 to $11 in July 2026.

Monthly price difference between ad-supported and ad-free tiers. The global average covers Netflix, Disney+ and Amazon Prime Video. Source: Ampere Analysis
TVREV's Alan Wolk considers that gap still insufficient for Netflix — the ad product is not attractive enough on price against the paid tier. For a customer signing up for a few months to watch one show, the previous difference was not enough to make the ad-supported product worth considering. The current US spread is $11, between $20 ad-free and $9 ad-supported. Some consumers will move on that, but given the $27 Premium tier carrying 4K and extra streams, his estimate is that it may need to reach $25 or even $30.
Wolk added that increases on ad-free tiers cannot continue indefinitely. His proposed alternative is for every major SVOD to build a completely free ad-supported tier: it widens the ad-supported base, promotes older programming, and creates a path to re-enrol lapsed subscribers with introductory offers. Netflix and Disney have both said they are exploring a free tier or FAST service.
North American ad-tier revenue at $45 billion, reaching 54% of subscription revenue
Ampere expects North American ad-tier revenue to exceed $45 billion this year and ad tiers to account for 54% of the region's subscription streaming revenue by the end of 2026 — 3.7 times the $12.2 billion of 2022.

North American ad-tier revenue and its projected share of subscription revenue. Source: Ampere Analysis
The phase in which revenue grew through subscription price increases is ending, with advertising taking its place. The weight of the ad inventory clause sitting alongside the 15-30% commission in a Channels contract grows with that shift.
The Wonder Project launched through Channels alone, retaining 40% at month eight
The Wonder Project launched inside Channels and nowhere else. Eight months in, it had retained nearly 40% of its subscriber base, about two points above the category average. Chief executive Kelly Merryman Hoogstraten has credited House of David as a main reason for growth. Amazon counted 40 million views for it — though Amazon has never publicly defined how a view is measured on Prime Video.

The Wonder Project storefront, operating inside Prime Video Channels only and positioned as a subscription service for values-driven storytelling. Image: The Wonder Project
The Wonder Project is also co-producing with Amazon Prime Video. The distribution counter doubles as a production partner, which marks the upper bound of the relationship a service on Channels can hold with Amazon.
Cancel the service and the app remains: Channels as a defence of resubscribe rates
The other utility Alexander identifies is resubscription. A customer who signs up for Peacock directly and cancels has no further reason to open that app. A customer who cancels through Channels keeps opening Prime Video for other free or paid content and encounters a Peacock show or game again on the main page. Resubscribing takes one click — the same structure as walking into a department store with nothing particular to buy.
The harder it becomes to grow revenue through price, the more that metric matters, because returning a lapsed subscriber is what remains once raising the price is off the table.
Half would cancel over not finding something to watch: Amazon's missing ingredient
Streaming consumers are lost between services. Gracenote found that about half of US streaming customers would cancel a service because of difficulty finding something to watch. YouGov found more than 35% paying for a service they had not opened in six months. Half of Gracenote's respondents blamed the sheer number of services for making discovery harder, and two-thirds said they want a unified guide across all services.

US streaming consumers on the discovery problem. The YouGov item comes from a separate study. Sources: Gracenote, YouGov
Channels, gathering several services onto one screen, is an answer for a lost viewer. Prime Video itself, however, has not become the first destination in streaming the way Netflix has. Hub Research data shows US audiences seeking out Netflix, YouTube and Disney+ before Prime Video. NBA and NFL rights help, but the preference gap remains. For the Channels flywheel to keep turning, Alexander argues, Prime Video needs more third-party content that makes people open the app.
Netflix, Disney+ and Hulu remain outside, holding nearly 13% of US TV viewing
In Nielsen's Gauge, Disney+, Hulu and Netflix together account for nearly 13% of US TV viewing time. None of the three is sold through Prime Video Channels. Amazon takes 67% of specialty gross adds, but the top band of viewing time sits off the shelf.

Share of total US TV viewing by medium, and share by streaming platform. Disney covers Disney+, ESPN+ and Hulu SVOD; Paramount covers Paramount+ and Pluto; Warner/Discovery covers Discovery+ and HBO Max. Source: Nielsen, The Gauge, June 2026
Why they are absent shows what business Channels is in. What BritBox and Acorn TV buy with a 15-30% commission is reach. Netflix and Disney already have it.
Apple TV, which joined in 2025, saw about 10% of its total subscribers arrive through Channels, per Antenna. One in ten from a single route is not a trivial share, but the other 90% came from elsewhere. Where specialty services lean on Channels, an operator with scale keeps it as one route among several.
Alexander argues that if Channels were genuinely indispensable, the partner roster and the share of premium arrivals would be larger. Amazon's share is growing but is not yet the inevitable counter. The room to grow is considerable, though, and consolidation will move the balance: more operators with scale means more who can stay off the shelf, while more mid-sized players squeezed out of consolidation means more who depend on it.
Can Korean streaming survive abroad on its own?
Korean streaming operators knocking on the global market sit closer to the second group. The reality is that leaning on a distribution platform such as Amazon Prime Channels is more available to them than launching alone.
What the weaker party in a negotiation can secure is not the rate but the clauses. There is no leverage to cut 15-30%, but there is room to write everything else into the contract: the rate from month thirteen, how it applies to resubscriptions, the ad inventory share, shelf placement, and the definition of a view.
What this means for Korean streaming operators going global
— Offsetting the commission with price increases is no longer available. Average increases across the three majors fell from 24% to 14% and from $1.67 to $1.54. Planning to recover a 15-30% commission through future price rises does not match market conditions. Entry pricing has to be recoverable from the start, and the benchmark is 54% three-month survival.
— The real negotiation is ad inventory, not the subscription split. North American ad-tier revenue is forecast above $45 billion this year and at 54% of subscription revenue by end-2026. The 15-30% commission is a known band; the ad inventory share varies in ratio and selling party by contract. Moving negotiating time from the rate to the inventory clause changes the three-year P&L far more.
— Entering without an ad tier discards one axis of growth. Over three years, ad-free tiers rose $1.62 against $1.21 for ad-supported tiers: keeping the ad tier cheap while building its base is the common arrangement across all three majors. For a Korean operator unable to stand up a US ad sales organisation, the realistic form is delegating inventory sales to the platform while writing the revenue share and a floor rate into the contract.
— The first-twelve-month condition overlaps the survival curve. The commission applies to the first twelve months, and twelve-month specialty survival is 27%, so the period of heaviest commission coincides with the period holding the most subscribers. The rate from month thirteen, and how it applies to resubscriptions after a cancellation, belong in the contract.
— The 20% attachment rate is the value of shelf position. About one in five Channels sign-ups adds a second service within six months, and where that attachment goes is decided by merchandising. Main-page exposure, recommendation placement and campaign participation belong in the agreement alongside the rate.
— Decide in advance when a free tier opens. Wolk argues every major SVOD will need a completely free ad-supported tier, and Netflix and Disney have said they are exploring one. Korean libraries hold ample back catalogue for promoting older programming and re-enrolling lapsed subscribers. Standing up FAST channels ahead of a paid service is a sequence worth considering.
Is the Korean broadcasters' global streaming strategy finished?
What is finished is the route of entering the US market as a standalone service and growing it through successive price increases. The business of selling an archive has, if anything, better conditions than before. What changed is where the value attaches: from subscription price to ad inventory.
— An archive's value now sits in ad inventory rather than subscription price. With pricing headroom closed and advertising passing half of subscription revenue, the competitive property of a broadcaster archive is the volume of hours it can carry advertising against. That is the position from which BritBox and Acorn TV sell British broadcast archives. For a broadcaster weighing a standalone service, the test is not library size or profile but how many hours can be monetised through repeat viewing.
— Design FAST and paid subscription as one sequence. The purpose Wolk assigns a free tier is promoting older programming and recovering lapsed subscribers. Whether the FAST channels a broadcaster already operates overseas connect as an intake path to a paid archive service is the point to check. If the two run under separate teams against separate metrics, no sequence has been designed.
— Not losing the resubscription path is what matters. A direct subscriber who cancels has no reason to reopen the app. Archive services, releasing new titles rarely, depend more on resubscription than on new acquisition — and inside Channels an exposure path survives the cancellation. That belongs in the calculation when weighing the 15-30% commission.
— Co-production proposals can be bundled with distribution talks. The way Amazon co-produced House of David with The Wonder Project has the distribution counter doubling as a production partner. That is where a broadcaster's production capability can be traded against distribution terms. A negotiation to hand over content should be prepared alongside one that adds production.
— Define the view metric in the contract. House of David's 40 million views were cited, but Amazon has never disclosed how it counts a view on Prime Video. For the same title, Puck reports Amazon-counted views while Amazon MGM Studios' press release reports worldwide viewers for season one — the units do not match. If the ad inventory share is tied to impressions, the calculation cannot be left undefined.
Sources
Puck, "Prime Video Is Finally Becoming the Amazon of Streaming" (Julia Alexander), 19 August 2026 — https://puck.news/amazons-streaming-flywheel-the-everything-store-of-tv/
StreamTV Insider, "Major SVODs widen price gap between ad-supported, ad-free plans" (Bevin Fletcher), 24 August 2026 — reporting Ampere Analysis — https://www.streamtvinsider.com/advertising/major-svods-widen-price-gap-between-ad-supported-ad-free-plans
Antenna, State of Subscriptions: Specialty SVOD Landscape 2026 — gross adds by distributor, survival rates, new-entrant acquisition
Antenna, "Q3'26 State of Subscriptions: Specialty SVOD" report page — https://www.antenna.live/reports/q326-state-of-subscriptions-specialty-svod
Nielsen, The Gauge: Nielsen's Total TV and Streaming Snapshot, June 2026 (total day, persons 2+) — https://www.nielsen.com/data-center/the-gauge/
Amazon, KOCOWA on Prime Video channel page ($7.99/month) — https://www.amazon.com/gp/video/channel/9c7e544e-1e84-4b03-b6f9-d6fc5acec1ec
Amazon, 2014 Letter to Shareholders (the flywheel) — https://www.aboutamazon.com/news/company-news/2014-letter-to-shareholders
Business Wire, "KOCOWA Expands UK Presence with Launch on Prime Video," 17 September 2025 — https://secure.businesswire.com/news/home/20250917617898/en/KOCOWA-Expands-UK-Presence-with-Launch-on-Prime-Video
Variety, "Roku Launches Howdy No-Ads Streamer Priced at $3 per Month," 5 August 2025 — https://variety.com/2025/digital/news/roku-howdy-pricing-no-ads-launch-1236478566/
TechCrunch, "Roku's $3 streaming service Howdy will be coming to other platforms, CEO says" (CES 2026) — https://techcrunch.com/2026/01/roku-howdy-other-platforms-ces
Amazon MGM Studios press release, "Wonder Project to Launch Subscription Offering in Fall 2025 Exclusively on Prime Video in the U.S.," 24 June 2025 — https://press.amazonmgmstudios.com/us/en/press-release/wonder-project-to-launch-subscription-offering-in-
TheWrap, "Wonder Project Streaming Subscription to Launch on Prime Video in October," 28 August 2025 — https://www.thewrap.com/wonder-project-streaming-subscription-prime-video-launch-date-pricing/