

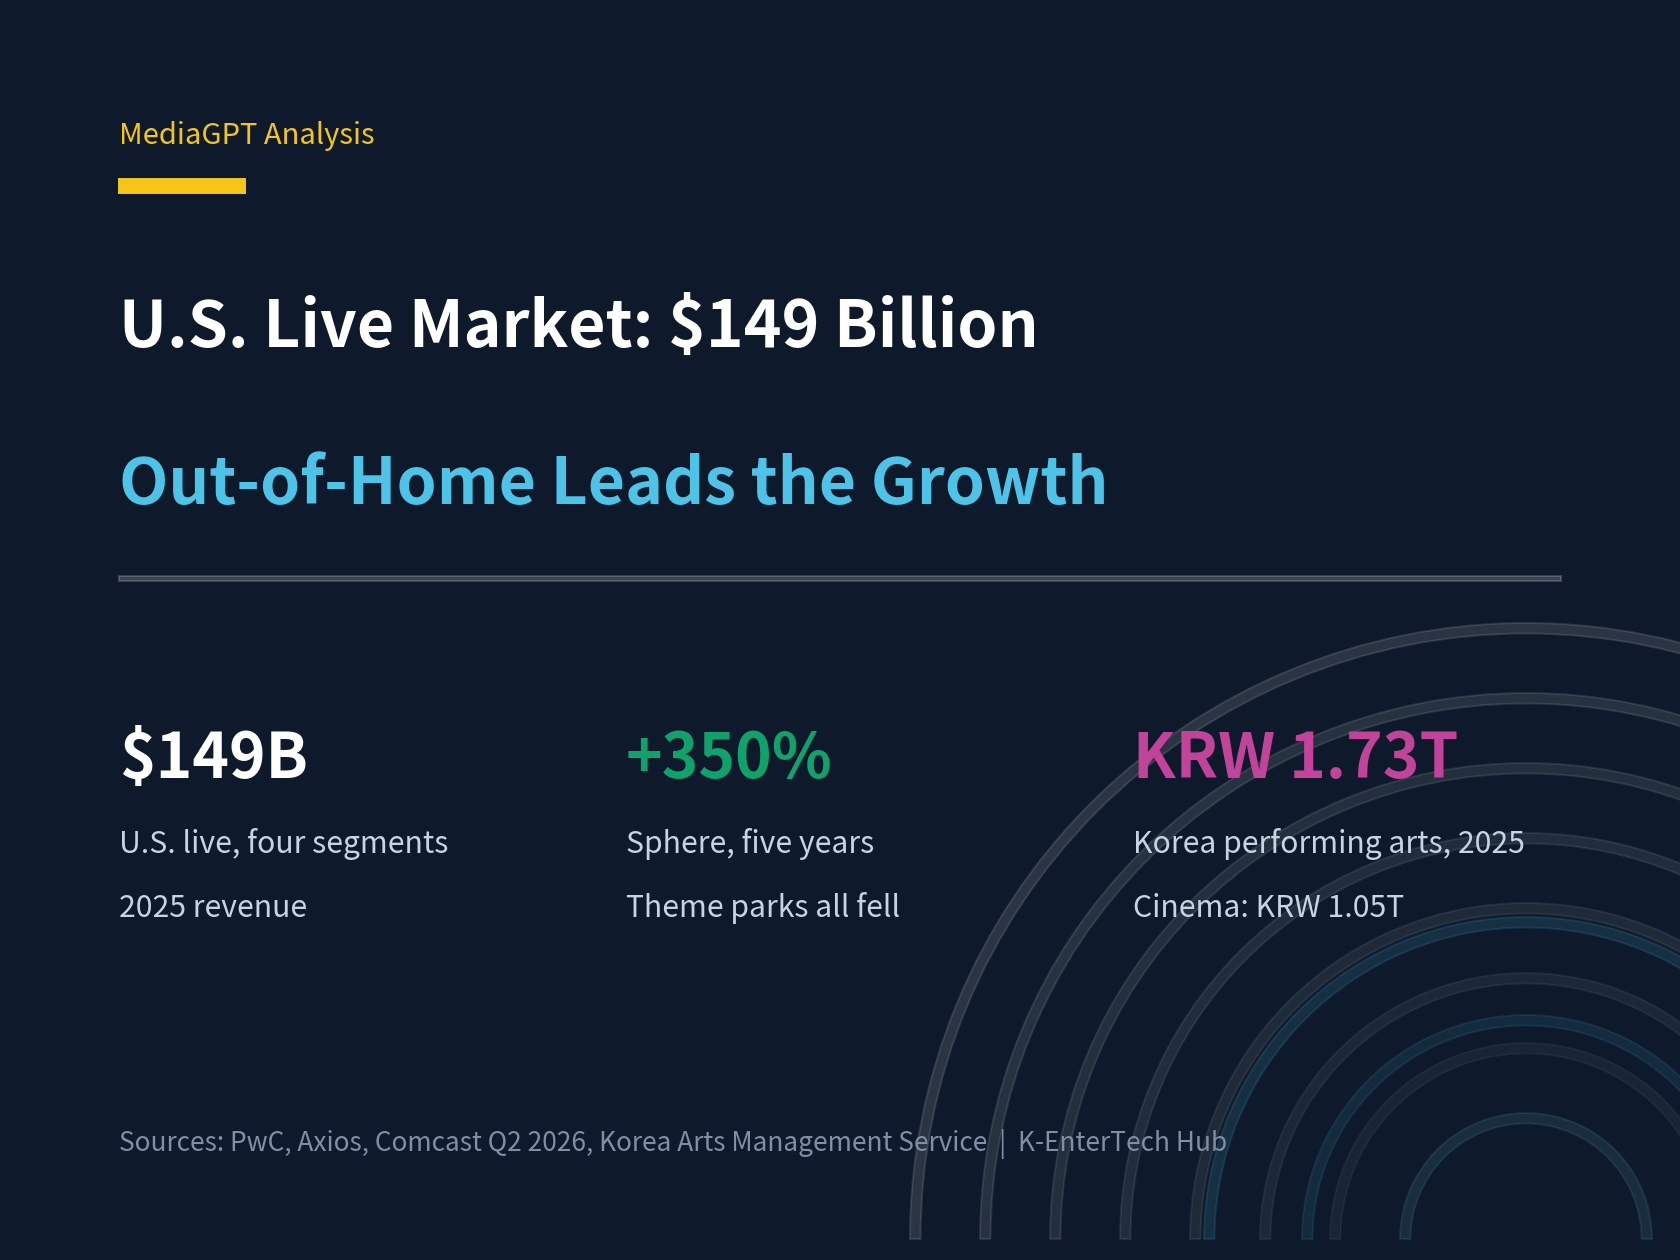
U.S. live market hits $149 billion… out-of-home is the largest single addition to growth

>As generative AI drives the supply of digital content toward the unlimited, capital has moved to the seat that cannot be copied. U.S. live segment revenue has nearly doubled since 2021 to roughly $149 billion in 2025, and PwC projects $174 billion by 2030

U.S. live market hits $149 billion… out-of-home is the largest single addition to growth
Sphere up 350% and IMAX 215% over five years while every theme park name trails the index… Peacock turns a first profit at $189 million, and Korean performing arts overtake cinema at KRW 1.7326 trillion

Media capital is moving off the screen and into the room. U.S. revenue across cinema, live music, out-of-home (OOH) advertising and trade shows has nearly doubled since 2021, reaching about $149 billion in 2025. PwC expects that figure to climb to $174 billion by 2030. On a global basis, spending across the same four segments is projected to approach $294 billion by 2030.

Two structures push the shift. The first is supply. Generative AI has driven down the unit cost of video, music and images, moving digital content toward unlimited supply and stripping out the scarcity that held up ad rates and subscription pricing on screen. The second is the seat. Stadiums and concert halls do not add capacity on demand. Only goods with fixed supply retain pricing power, and Wall Street has begun pricing the difference.

SeatGeek chief executive Jack Groetzinger told Axios the post-pandemic rebound is well behind the market and current levels are the new baseline. He added that AI reinforces the trend because people place value on what is real rather than synthetic.

Sphere up 350%, IMAX up 215%… every social entertainment name is down

Laying five years of entertainment stock performance out by segment, from August 2021 to August 2026, marks the boundary of the live boom. The S&P 500 rose 72% over the same period.

Source: reconstructed from Axios, 'Change in select entertainment stocks' (Financial Modeling Prep data, Aug. 2, 2021–Aug. 3, 2026), shown as end-point change by segment. Values are approximations read from the original chart. Marcus, Cineplex and Dolby are omitted because their series could not be distinguished in the original; the three ended roughly between -45% and +90%.

Sphere Entertainment leads at 350%, having exceeded 420% at its peak. Live Nation follows at 130%, MSG Sports at 145% and Formula One (F1) at 120%. Among theater names, IMAX rose 215% and Cinemark 155%. Each either handles events with fixed seating or owns the venue and the format that contains them.

The other side is the always-open venue. None of the four theme park names beat the index. United Parks finished near flat, Disney fell 45%, Comcast 55% and Six Flags 58%. In social entertainment — bowling alleys and arcades — all three names declined: Bowlero 33%, Topgolf 43% and Dave & Buster's 65%.

Outcomes split within segments as well. AMC lost close to its entire value over the five years, and ticket resale platform Vivid Seats fell 98%. A growing live market does not by itself explain company performance. IMAX and Sphere turned the format and the building into scarce assets; AMC and Vivid Seats sat in the position of intermediating events other people created.

Sphere up 51.4% year to date… theater names that lagged for five years turn double digit

Narrow the window to this year and the order changes. Between January 2 and June 2, 2026, Sphere rose 51.4% and MSG Entertainment 33.3%. Theater names that were negative on a five-year basis moved up in this window: Cinemark 25.7% and AMC 25.2%. Live Nation gained 16.0% and IMAX 10.3%.

Source: reconstructed from Axios, 'Change in select theater and live entertainment stock prices' (Financial Modeling Prep data, Jan. 2 to June 2, 2026)

Earnings are behind the theatrical rebound. Cinemark said on June 1 that it delivered its highest-ever domestic May box office, along with its highest-ever food and beverage spend per patron that month.

AMC reported its best-attended May since 2019 both domestically and globally.

The horror title Backrooms posted the largest opening day in the genre's history. For the first time since the pandemic, the production pipeline has held steady, widening the range of genres reaching audiences — and premium seating, screens and concessions are visibly carrying the recovery.

On the venue side, Sphere's first-quarter 2026 revenue rose 69% year over year, lifted by concert residencies, and that result is feeding investor expectations around planned expansions in Abu Dhabi and at National Harbor outside Washington, D.C. Madison Square Garden Entertainment benefits from the Knicks' playoff run, but its growth also rests on a slate of live experiences unique to New York, the Rockettes among them.

Live Nation gained 16% year to date even after being found in violation of federal antitrust law in April — the market is weighting live demand more heavily than litigation risk.

The advertising logic runs the same way. As mobile screen time keeps climbing, formats where attention is undivided command a higher price. National CineMedia, the largest cinema advertising seller in the United States, has climbed out of the 2023 bankruptcy that followed its balance-sheet crisis as the cinema ad market recovered. The Captivate acquisition described below sits on top of that recovery.

Four segments, $149 billion in the U.S… double the 2021 level

PwC's Global Entertainment & Media Outlook 2026-30 projects total industry revenue of $4.2 trillion in 2030 at a 3.4% compound annual growth rate, naming AI-powered advertising and in-person live experiences as the two engines. Industry revenue grew 5.3% in 2025 to $3.5 trillion and is expected to add another 4.6% in 2026.

By segment, spending on trade shows and business festivals reached $38 billion in 2025, roughly the scale of live music globally, and is projected to grow at 3.3% annually to $44.6 billion by 2030. Cinema remains on a recovery path toward pre-pandemic levels, led by Asia-Pacific. Growth rates have cooled from the immediate post-pandemic rebound, but the direction differs from broadcast television, now in decline, and from streaming in its mature markets.

Segment

2025

2030 forecast

Notes

U.S. live, four segments

(cinema, live music, OOH, trade shows)

About $149bn

About $174bn

Roughly double 2021. Cinema includes box office and in-cinema advertising

Global live, four segments

About $294bn

In-person experience spending, PwC Outlook 2026-30

Global trade shows and business festivals

$38bn

$44.6bn

3.3% CAGR; comparable in scale to global live music

Global online betting and gambling (GGR)

$79.5bn

$119.7bn

8.5% CAGR; more than double the $37.1bn of 2021, and larger than cinema

Global entertainment and media

$3.5tn

$4.2tn

3.4% CAGR; advertising reaches $1.4tn in 2030

Source: PwC Global Entertainment & Media Outlook 2026-30; Axios compilation, August 2026

Cinema stalls at $35 billion… out-of-home is the largest single addition over the next five years

Stacking the same market by segment shows where the growth originates. U.S. live revenue rose from $78 billion in 2021 to $138 billion in 2023, then flattened into a gentler curve. The first two years were recovery — venues reopening after the pandemic — and the 3% to 4% annual pace since 2023 is the market's underlying growth rate.

Source: reconstructed from the Axios chart 'Annual U.S. live media and entertainment revenue,' citing PwC Global Entertainment, Media & Telecoms Outlook 2021-2030. Cinema includes box office and in-cinema advertising. Figures from 2026 are forecasts, and values are approximations read from the original chart.

Cinema peaked at $37 billion in 2023, fell to $33 billion in 2024 and has since moved around $35 billion, with a 2030 forecast of $42 billion. Out-of-home advertising, by contrast, climbs from $28 billion in 2021 to $47 billion in 2030, and trade shows from $15 billion to $44 billion. Breaking down the $25 billion of growth between 2025 and 2030 by segment: out-of-home adds $9 billion, cinema $7 billion, trade shows $6 billion and live music $3 billion.

Growth in the live market, in other words, comes less from the ticket than from the advertising attached to the room. NCM's Captivate acquisition sits precisely there. Bundling cinema screens with office and residential screens into one network is not a business of adding audience; it is a business of adding advertising surface in spaces where the audience already is. Operators that own the building hold both layers, ticket and inventory, at once.

Attendance as social currency… the always-open venue never becomes a post

PwC partner Bart Spiegel describes live attendance as a form of social currency, particularly for younger consumers. Being at a concert or a game becomes part of a person's identity the moment it appears on Instagram or TikTok. Always-open venues rarely meet that condition — a visit you can make any day does not become a post.

Operating conditions compound the gap. Dave & Buster's and Comcast/NBCUniversal both cited higher fuel prices and airfares among the factors weighing on their most recent quarters. When travel costs rise, destination venues lose visit frequency first.

Universal Orlando attendance softens from June… revenue $2.4bn, adjusted EBITDA down 5.1%

The most concrete numbers came from Comcast's second-quarter results on July 23. Attendance at Universal Orlando ran below expectations, with the softening beginning in June and continuing into the third quarter. Co-chief executive Mike Cavanagh attributed it to higher fuel prices and weaker consumer sentiment, describing them as temporary factors the company is watching closely. No attendance figures were disclosed.

Metric

Q2 2026

Year on year

Notes

Theme park revenue

$2,413m

+2.7%

Orlando growth led by Epic Universe

Theme park adj. EBITDA

$609m

-5.1%

Weakness across the broader resort; pressure at Universal Japan

Orlando attendance

Not disclosed

Below expectations

Softening from June, continuing into Q3

Source: Comcast second-quarter 2026 results and earnings call; FOX 35 Orlando, July 23, 2026

Revenue rose and adjusted EBITDA fell. The revenue gain came from Epic Universe, which opened last year and, in Cavanagh's words, continues to deliver the guest response the company expected. The new park worked; when visit frequency across the broader resort fell, margin gave first. Pressure at Universal Japan, where China-related travel restrictions hit attendance, fed into the same line. The structural weakness of the always-open venue shows up in a single quarter's statement.

The explanation offered is the same one Dave & Buster's gave. Fuel prices and consumer sentiment cut visit frequency at destination venues before anything else, and the same structure sits behind Comcast's 55% five-year decline in the chart above.

Investment continues regardless: a Universal Kids resort has opened in Texas and a U.K. resort is planned. In Orlando, a Fast & Furious roller coaster is under construction for a 2027 opening, and the Lost Continent area at Islands of Adventure is being demolished for a replacement not yet announced. The company says its long-term outlook for parks is unchanged.

Disney Experiences revenue reaches $9.97 billion in Q3… attendance up 3% and per-capita spending up 4%

Results split within the same theme park segment. Disney's Experiences revenue rose 10% year over year in the third quarter to $9.97 billion from $9.09 billion.

Domestic parks and experiences led with an 11% revenue gain, and global guests — theme park attendance combined with cruise passenger days — rose 4%. Domestic park attendance alone grew 3%, and per-capita spending at domestic parks rose 4%: volume and spend per head moving up together. Universal Orlando, which lost margin as attendance softened, went the other way.

Pricing power, though, shows a ceiling. Disney World's line-skipping product, Lightning Lane, runs in three tiers — Single Pass, Multi Pass and Premier Pass. The Premier Pass, which covers a park's entire attraction lineup for the day, has climbed as high as $449 in peak periods such as spring break, Thanksgiving and Christmas and still sold out.

From September, however, the Premier Pass at all four parks drops to its lowest level at once: $299 at Magic Kingdom, $249 at Hollywood Studios, $149 at EPCOT and $119 at Animal Kingdom. Multi Pass pricing has been cut with immediate effect.

Park

September Premier Pass

Prior range

Notes

Magic Kingdom

$299

$300-$400

Lowest-ever $299 from Aug. 23; $329 on Aug. 28

Hollywood Studios

$249

Lowest level to date

EPCOT

$149

Lowest level to date

Animal Kingdom

$119

Lowest level to date

Peak pricing

$449

Sells out at spring break, Thanksgiving and Christmas

Source: Disney third-quarter results and Walt Disney World Lightning Lane pricing; Inside the Magic, Aug. 11, 2026

Two things drive the cut. One is programming: the dates coincide with Mickey's Not-So-Scary Halloween Party, which requires day guests without event tickets to leave the park by 6 p.m. Shorter operating hours bring the price of expedited access down with them. The other is the calendar. The last week of August, when families return to school schedules, has traditionally been the quietest stretch at Walt Disney World, with average wait times under 25 minutes over each of the past three years.

The price of a premium product follows the demand of the day, not the specification of the venue. $449 and $119 are the same company, the same product, different dates. The problem PwC identified — price rising faster than experience — and the ceiling Six Flags found through falling attendance are what Disney is managing by separating peak pricing from off-peak.

Short lines, higher revenue… the four levers Disney pulled

Social media filled up this summer with videos of short waits at Disney parks; in June one creator filmed a sparse Disneyland and remarked that it was midsummer and the park was not crowded. Yet parks and cruises revenue rose 10% in the same quarter, the strongest increase in two years, global park attendance grew 4%, per-guest spending rose, and occupancy at domestic resort hotels hit 91%. The short lines were not a sign of fewer visitors.

Industry analysts point to four levers: narrowly targeted discounting, expanded programming for young children, renovation of existing attractions to drive repeat visits, and operating efficiency in the skip-the-line service.

The discounting was aimed rather than broad. Disneyland Resort in California sold single-day park hopper tickets for children aged three to nine at $50 all summer, against a normal range of $168 to $279. In Florida, an adult dining plan purchase brought a free dining plan for a child in the same age band. Disney+ subscribers could book value-level Walt Disney World hotels from $99 a night when standard rates ran $174 to $225. Beci Mahnken, chief executive of MEI-Travel, said Disney had not suddenly become inexpensive but had found ways to add value and widen choice without diminishing the experience. Chief executive Josh D'Amaro told the earnings call the company was not discounting its way to growth.

Offer

Promotional price

Standard price

Conditions

Park hopper day ticket, ages 3-9

$50

$168-$279

Disneyland Resort, California, all summer

Dining plan, ages 3-9

Free

Florida, with an adult dining plan purchase

Value resort hotel, per night

From $99

$174-$225

Walt Disney World, for Disney+ subscribers

Source: CNN, Aug. 13, 2026; MouseSavers.com

The second and third levers used existing assets rather than new capital. One of the longest queues at Disneyland this year formed for Bluey's Best Day Ever!, a children's show installed in a theater space that had sat dormant for months, and a companion show in Florida performed similarly. The Florida resort refreshed established attractions including Buzz Lightyear's Space Ranger Spin and Big Thunder Mountain Railroad, and gave its Rock 'n' Roller Coaster a Muppets theme. Long-term projects to build new lands continue, but this year's emphasis was on comparatively inexpensive renovation.

The fourth is operations. Waits shortened not because crowds thinned but because allocation in the skip-the-line service improved and ride maintenance became more proactive, according to the company. The current Lightning Lane structure launched about two years ago and has been tuned to guest patterns since. Underused space was reworked in parallel so that more people could be absorbed without lengthening queues — the Studio Lot courtyard at Walt Disney World is the example most often cited. The effect is space where there is something to do other than stand in line.

Set against competitors in the same quarter, the gap is clear. Universal grew revenue 2.7% but saw attendance soften at its two older Orlando parks. United Parks & Resorts, which operates SeaWorld and Busch Gardens, reported attendance down 2.9% and revenue down 1.4%. Thomas Mazloum, chairman of Disney Experiences, told employees in an internal memo that guest surveys showed high satisfaction and intent to return across nearly every market. In identical consumer conditions, what separated the results was not price but how a reason to visit was manufactured.

Dave & Buster's same-store sales fall 5.4%… a 13th straight quarterly decline, with April the break point

The condition of the always-open venue is sharper still in Dave & Buster's first quarter. Same-store sales for the period ended May 5 fell 5.4% year over year against a market expectation of a 1.2% decline; the quarter opened flat and broke sharply in April. It was the thirteenth consecutive quarterly decline. Management cited the economy, fuel prices, geopolitical uncertainty and meaningful softness in consumer sentiment, with the heaviest fall-off among lower-income customers. The stock dropped nearly 19% in pre-market trading on the day and closed down 4.6%.

Metric

Q1 2026

Year on year

Notes

Same-store sales

-5.4%

13th straight decline

Market expected -1.2%; current quarter running -4%

Total revenue

$559.2m

-1.5%

247 North American locations across Dave & Buster's and Main Event

Net income

$5.7m

Down from $21.7m

Free cash flow improved to $25.3m from -$58.8m

Food and beverage same-store sales

+5%

Ninth straight month of growth

Menu work is landing; the weakness sits on the game floor

Capital expenditure plan

$200m

Cut from $270m

Eleven new locations still planned, subject to returns

Source: Dave & Buster's first-quarter 2026 results and earnings call; Restaurant Business, June 16, 2026

The segment numbers show where the problem sits. Food and beverage same-store sales rose 5%, a ninth consecutive month of growth. The game floor is what broke, and what customers complained about was not price but a lack of newness. An unlimited gaming pass starting at $1 a day pushed a value message that failed to land. The company brought in new games for the first time in six years, placing ten machines tied to franchises such as John Wick and Hot Wheels with five more due this year; many, management says, already rank among its top revenue generators. Content, not price, brought the traffic back.

The response the company reached for was event programming. The company is looking to the FIFA World Cup for summer traffic, packaging selected matches as ticketed watch parties with all-you-can-eat wings and fries and unlimited gameplay at $24.99, placing World Cup tickets in its crane games, installing two soccer-themed arcade machines and adding host-country menu items. A permanent venue is borrowing a time-bound event to move its numbers — the same World Cup that lifted Peacock's media revenue. What separated results in this quarter was, again, scarcity.

The rest of the response is operational. Chief executive Tarun Lal, who joined last summer from Yum Brands, has set a back-to-basics agenda across marketing, food and beverage, games and operations, and named speed of service as the company's defining metric for 2026: greet within one minute, take drink orders within four. Six locations reopened with a revised layout are running 7% same-store sales growth on average, at half the remodel cost of the 2024 and 2025 packages for the same return. The company is holding to its goal of turning same-store sales positive before its fiscal year ends in February.

Peacock turns its first profit at $189 million… 48 million subscribers, built on the World Cup and the NBA

The other segments in the same filing make clearer where the value of live attaches. Comcast's Content & Experiences revenue rose 22.9% to $10.7 billion and adjusted EBITDA 7.1% to $1.3 billion. Theme parks did not produce that increase; media and studios did.

Segment

Q2 2026 revenue

Adj. EBITDA

Driver

Theme Parks

$2,413m (+2.7%)

$609m (-5.1%)

Epic Universe strength; broader resort below expectations

Media

$5,691m (+25.3%)

$708m (+3.7%)

Peacock's first profit; FIFA World Cup and NBA playoffs

Studios

$3,040m (+25.0%)

$202m

Theatrical results for The Super Mario Galaxy Movie and Obsession

Segment total

$10.7bn (+22.9%)

$1.3bn (+7.1%)

Against $8.7bn revenue and $1.2bn adj. EBITDA a year earlier

Source: Comcast second-quarter 2026 earnings materials, Content & Experiences

Media revenue rose 25.3%, and excluding $440 million of incremental revenue from the FIFA World Cup, media revenue was still up 16% and advertising up 24%. Peacock turned its first profit in the quarter, generating $189 million of EBITDA and lifting media EBITDA growth to 4% even while absorbing first-year NBA rights costs. Paid subscribers grew by two million in the quarter to 48 million, which the company attributed to the NBA playoffs, the World Cup and Love Island USA.

Directions diverged inside a single company in a single quarter. The always-open venue lost margin; the streaming service that programmed live events reached profitability for the first time. The value of live attaches to the event, not to the building. Sports rights costs have long been named as the heaviest drag on streaming economics, and Peacock cleared them this quarter and still turned a profit — the same structure that produced Sphere's 69% first-quarter revenue growth out of concert residencies.

The money sits outside the ticket… rights doubled in a decade, concessions carry theaters

Much of the profit in live is made outside the ticket. U.S. sports media rights have exactly doubled over the past decade. Theaters take most top-line revenue from admissions, but concessions generate the profit. That structure pushes operators to raise the amount recovered per event.

U.S. sports rights reach $29.25 billion… doubled in a decade, $37 billion by 2030

Kagan, part of S&P Global Market Intelligence, estimates U.S. television and streaming sports rights payments at $29.25 billion in 2025 — exactly double the estimated $14.64 billion of 2015, and set to exceed $37 billion by 2030 as new deals are struck.

That figure is more than half of global rights spending. Globally, an estimated $57.2 billion was spent in 2025, down from a 2024 total above $60 billion, as roughly $3.5 billion in Paris Olympics broadcasting fees and at least $1.5 billion from UEFA Euro 2024 left the system. Even years rise faster than odd ones, so Olympic and World Cup scheduling swings the annual figures.

Item

Amount

Period

Notes

U.S. rights payments

$14.64bn

2015

Kagan estimate

U.S. rights payments

$29.25bn

2025

More than half of global spending

U.S. rights payments

Over $37bn

2030 forecast

Reflects deals still to be signed

Global rights spending

$57.2bn

2025

Above $60bn in 2024

US Open tennis, U.S. rights

About $170m a year

2026-2037

ESPN, 12-year agreement

Source: Kagan, S&P Global Market Intelligence (Scott Robson)

The shape of the contracts is changing too. As deals between regional sports networks and clubs expire and the RSNs' financial strain grows, teams are moving toward partnerships with local broadcast stations and their own direct-to-consumer services.

As of March 27, Kagan counted 96 separate local game rights deals between MLB, NBA, NHL and WNBA teams and local stations, ranging from packages of one to ten games up to full-season blocks of 40, 60, 70 or more than 80 — the Dallas Mavericks, Florida Panthers, Las Vegas Aces, Golden Knights, New Orleans Pelicans, Phoenix Suns, Seattle Kraken and Utah Jazz among those with the largest.

Renewals are also clustered. The NFL, NBA, NHL, NASCAR and college sports all extended in the past two years at steep increases, and the UFC, Formula 1, the Pac-12 and Mountain West conferences, and the MLB package held by ESPN — about 30 regular season games plus a wild card series — are approaching renewal. Having lost the NBA, Warner Bros. Discovery picked up the French Open, Big East college basketball, a midseason NASCAR slate and the women's league Unrivaled. ESPN secured exclusive U.S. rights to the US Open tennis championship for twelve years from 2026 to 2037 at around $170 million a year. Each renewal came at a substantial premium to the prior contract.

For live group-exhibition rights, the timing is favourable. A single match is already being divided into national rights, local rights and a club's own direct-to-consumer feed. When the schedule of rights is being subdivided, a new line is easier to insert.

Leagues are selling more sponsored jersey patches. Theme parks are extending premium passes beyond line-skipping. Theaters are installing recliners and serving full meals, and stadiums are adding digital billboards. Upselling families has worked as well: Disney has been an outlier in the theme park sector partly through a targeted discount strategy aimed at families with young children.

Ohio State's jersey patch fetches $17 million… college sport opens its advertising surface

The structure expanded fastest not in the professional leagues but in U.S. college sport. With the NCAA's jersey sponsorship rule taking effect on August 1, Notre Dame, Ohio State, LSU and Wisconsin all added patches at once. Ohio State is taking in $17 million for the space and Notre Dame as much as $20 million; a Chase Bank logo now sits on the Ohio State jersey.

A single uniform carries more than one emblem. A school's own sponsor, its apparel company, its bowl game and its captaincy mark all sit side by side, with a conference title sponsor on top — the Big 12 has attached Monster Energy to its own name. The driver is player compensation: with direct payment to athletes now legal, schools are covering higher roster costs by selling advertising inventory. Surface that amateurism kept closed for decades opened all at once under cost pressure.

Six Flags' pricing backlash, the Van Gogh bankruptcy… two limits on expansion

Pricing power is bound to the value of the experience. PwC principal CJ Bangah notes that trouble arrives when prices keep rising while the experience does not improve. In 2022 Six Flags raised ticket prices and cut discounts to attract higher-spending visitors; attendance fell and earnings followed.

The second limit is saturation. Immersive Van Gogh exhibitions spread rapidly in 2021 and 2022, but competing shows oversupplied the market, and the company behind the most popular version entered bankruptcy in 2023. Expansion by replicating a single format consumes its own scarcity.

Five Van Gogh shows toured at once… the infinite copy the public domain allowed

The scale of the oversupply was already visible in April 2021, when five competing immersive Van Gogh exhibitions were touring the United States. All used projection, screens, music and virtual reality, and some added scent, to market immersion. Tickets ran as high as $100. Immersive Van Gogh, headed for Orlando that autumn, Van Gogh Alive at the Dalí Museum in St. Petersburg and Van Gogh: The Immersive Experience in Miami were separate shows that shared little beyond a name.

Consumers could not tell them apart, and buyers kept turning up believing they had tickets to the same exhibition. It worsened when ticket vendor Fever brought in Van Gogh: The Immersive Experience at higher prices, competing in the same cities on the same dates as Imagine Van Gogh. Rob Kirk, head of commercial operations at Grande Experiences, argued that Van Gogh Alive came first in 2011, that the others did not exist before 2015, and that they were copycats. What lit the demand was Netflix: interest surged after Immersive Van Gogh appeared in Emily in Paris.

The reason the market had no barrier to entry was copyright. William Powhida, an artist and former critic, put the whole thing down to fair use — Van Gogh's work is old enough to be legally reproduced. Public domain IP costs nothing to license, which makes entry easy and, for the same reason, leaves no way to keep later entrants out.

Grande Experiences extended the same format to Leonardo da Vinci, Claude Monet and the French Impressionists under identical conditions. The result was shows on the same subject competing in the same city on price alone, and two years later the operator of the most popular one entered bankruptcy.

Licensed IP costs money to obtain, and that cost is itself the barrier to entry. The real defensible line in the immersive venue business is not deciding what to screen before the building goes up, but whether anyone else can be prevented from screening it.

IMAX explores a sale… premium screens hold 16% of tickets, market cap $1.85 billion

IMAX went to market first. The Wall Street Journal reported on May 21 that the company is exploring a sale and has approached entertainment companies as potential buyers, with the caveat that the process is early and may not produce a deal.

Behind the process is a premium segment growing faster than the box office as a whole. Domestic grosses reached about $2.9 billion by late May, the highest for the comparable period since before the pandemic, according to Box Office Mojo.

Premium screens including IMAX accounted for 16% of ticket sales in the United States and Canada through early April, against 13% in the same period of 2021, per EntTelligence. IMAX alone took 5.2% of the domestic box office last year, up from 3.2% in 2019. Titles built for its screens and marketed as spectacles worth the best theater — Avatar: Fire and Ash and Project Hail Mary among them — carried that share.

Metric

Latest

Comparison

Source

Premium screen share of tickets

16%

13% in 2021

EntTelligence, U.S. and Canada, through early April

IMAX share of domestic box office

5.2%

3.2% in 2019

IMAX

Domestic box office

About $2.9bn

Highest since before the pandemic

Box Office Mojo, year to late May

IMAX market capitalisation

About $1.85bn

Stock up 40% since last summer

As of May 21, 2026

Source: The Wall Street Journal (May 21, 2026); Box Office Mojo; EntTelligence

A $1.85 billion market capitalisation is a modest purchase for most of the likely buyers. Chief executive Rich Gelfond told an investor meeting last December that the company would be a valuable player whether it stayed a differentiated public company or became part of a larger one. The stock had risen about 40% since last summer but was down 7% year to date when the report ran; it jumped more than 10% in after-hours trading that day and stood 10.3% higher year to date by June 2. That reversal sits behind IMAX's position as the smallest gainer among theater names in the year-to-date chart above.

The obstacle is who buys it. A Hollywood company that acquired IMAX would face the question of whether it favours its own films: every studio releases on IMAX, and rivals compete for the premium screens when titles open together. Streaming makes the question heavier. Netflix will run a November film directed by David Fincher and starring Brad Pitt exclusively on IMAX screens for two weeks before it streams, and in February it will play Narnia: The Magician's Nephew in IMAX and other theaters seven weeks ahead of the service — its first full-scale theatrical release. The company built on unlimited supply is buying exhibition scarcity.

SeatGeek waits on an IPO, infrastructure vendors go up for sale… live consolidates

The capital markets are already producing deals. Ticket resale platform SeatGeek completed a confidential IPO filing in April 2023 and continues to appear on 2026 listing watchlists.

NCM buys Captivate for $275 million… adding 26,000 screens outside the theater

The most concrete transaction came from advertising infrastructure. National CineMedia (NCM), the largest cinema advertising platform in the United States, agreed on August 11 to acquire Captivate, the leading operator of digital elevator and lobby advertising in North America, at an enterprise value of $275 million. The seller is Generation Partners, the growth equity firm that bought Captivate in 2013. The price is about ten times Captivate's pro forma EBITDA, funded with $275 million of new committed term debt, and the deal is expected to close in the second half of this year.

What NCM is buying is screens outside the theater. Captivate runs more than 26,000 digital video screens in over 11,000 office and residential buildings across more than 170 DMAs in the United States and Canada. Its core sits in over 1,600 Class A and B office buildings, where reaching affluent professionals during the workday generates roughly 90% of its advertising revenue; a residential network started in 2023 has grown past 9,700 locations. Added to NCM's existing 22,000 or so theater and lobby screens across 1,750 theaters in 183 DMAs, the combined platform reaches more than 48,000 screens in 185 DMAs, including all of the top 100.

Item

NCM

Captivate

Combined

Screens

About 22,000

More than 26,000

More than 48,000

Coverage

183 DMAs

More than 170 DMAs

185 DMAs, all of the top 100

Locations

1,750 theaters

11,000 office and residential buildings

Theaters, offices, residences

Audience

Young, diverse moviegoers

Affluent professionals in Class A offices

Consumers and decision makers

Financials

Q2 revenue $58.4m (+12.7%)

2025 revenue about $64m, adj. EBITDA about $19m

$275m enterprise value, about 10x EBITDA

Source: National CineMedia announcement, Aug. 11, 2026

Tom Lesinski, NCM's chief executive, described the combination as reaching the audiences advertisers value most where they work, live and play. Captivate grew revenue about 40% and adjusted EBITDA more than 50% over the past two years, generating roughly $64 million of revenue and $19 million of adjusted EBITDA in 2025. Long-term building agreements and minimal ongoing capital requirements form one half of the rationale; the other is access to business-to-business budgets from enterprise technology, financial services and professional services advertisers through the workplace network.

NCM expects net leverage of about 3.9x at close and more than $3.5 million of annual run-rate cost synergies within the first year, and has paused its dividend and share repurchase programmes to direct free cash flow at debt reduction. With cinema attendance under pressure, the answer a cinema advertising company reached for was not more moviegoers but more places that hold attention the same way.

Hovercraft Ventures chief executive Jeff Kaplan sees the infrastructure beneath live events as open to consolidation. Live events typically require separate creative, production and technology vendors, and his firm is buying specialist shops on a bet that clients want a single end-to-end provider.

What this means for Korean players

The same shift is already visible in Korean numbers. Analysis of Korea Performing Arts Box Office Information System (공연예술통합전산망, KOPIS) data by the Ministry of Culture, Sports and Tourism (문화체육관광부) and the Korea Arts Management Service (예술경영지원센터) put 2025 performing arts ticket sales at KRW 1.7326 trillion, up 18.8% year on year and an all-time high. Tickets booked rose 10.8% to 24.78 million, and the average ticket price gained about KRW 5,000 to roughly KRW 70,000. Cinema moved the other way: the Korean Film Council (영화진흥위원회) reported 2025 box office revenue of KRW 1.047 trillion, down 12.4%, on 106.09 million admissions, down 13.8%. The two markets changed places.

Market

2025 revenue

Year on year

Demand indicators

Performing arts (KOPIS)

KRW 1.7326tn

+18.8%

24.78m tickets (+10.8%); average ticket about KRW 70,000

Cinema (Korean Film Council)

KRW 1.047tn

-12.4%

106.09m admissions (-13.8%); average admission KRW 9,869

Source: Ministry of Culture, Sports and Tourism and Korea Arts Management Service, 2025 Performing Arts Ticket Sales Report; Korean Film Council, 2025 Korean Film Industry Review

The first issue is the contract. Screening games and concerts for group audiences in theaters and arenas in Korea requires venue exhibition rights to appear as a separate line in sports and performance rights agreements. Korean rights contracts are drafted around broadcast and OTT, leaving group exhibition at a venue in a gray zone.

Building the facility before the rights are settled leads to disputes with incumbent rights holders. The timing is not unfavourable. While a single game in the United States is being split into national rights, local rights and a club's own direct-to-consumer feed, Korean rights contracts are entering their own renegotiation cycle — and the cost of adding a line is lowest while the schedule of lines is expanding.

The second is programming. An immersive venue's economics turn on days of operation per year, not screen specification. A site without a library of science, education and IP content to fill the sports off-season enters deficit the moment the opening effect fades. The Van Gogh case applies directly to Korea's immersive exhibition business: when the same format runs simultaneously in Seoul, Busan and Jeju, every operator's payback period lengthens together.

The third is revenue outside the ticket. Korean live businesses still concentrate income in tickets and merchandise. Set against a U.S. market that has added recovery points through media rights, concessions, sponsor patches and digital signage, venue advertising inventory and data-driven sponsorship remain largely unpriced assets. The way NCM bundled cinema screens and office screens into a single premium video network is a design Korean multiplex and venue operators can apply.

The asset in that business is not the screen but the long-term agreement with the building. It needs almost no ongoing capital, and an office network opens a separate wallet in B2B advertising budgets. No operator in Korea yet bundles cinema lobbies, performance venues, stadiums and office screens into a single unit of sale. Cinemark posting a record food and beverage spend per patron in the same month as its record May box office shows that per-head design comes before attendance recovery. Exhibition format belongs on the same list.

Premium screens take 16% of North American ticket sales and IMAX alone holds 5.2% of the box office. While Korean cinemas absorb falling admissions, how far the premium seat share and its price band can be pushed remains untested. U.S. colleges selling a single spot on a jersey for $17 million to $20 million follows the same logic. The next question is which surfaces Korean professional clubs, university sport and performance venues are still not selling — and what rule changes opening them would require.

The fourth is where K-pop concerts sit. Growth in Korea's 2025 performing arts market came from popular music staged in large venues. Applying the division the stock chart shows, K-pop tours belong in the scarce-event category alongside Sphere and MSG Sports, while permanent facilities sit closer to Bowlero and Dave & Buster's. When Korean operators evaluate permanent K-pop venues in the United States or Japan, the test is not the specification of the building but whether the building manufactures scarcity. Raising ticket prices first and filling in the experience later is the path Six Flags has already failed on.

Universal Orlando's second quarter adds one more rule: the opening period and steady-state operation have to be modelled separately. While Epic Universe lifted revenue, falling visit frequency at the existing parks pulled segment earnings down. Business plans for permanent venues that extrapolate first-year figures forward break at exactly this point. That Dave & Buster's reached for World Cup watch parties rather than price cuts to end thirteen quarters of decline points the same way.

The fix for a permanent venue is a time-bound event laid on top of it, not more of the standing programme — and that is precisely the problem Korean immersive exhibitions and experience venues meet once the opening effect fades. Pricing follows the same principle. Disney sells the same premium product at $449 in peak season and $119 out of it. Korean venue and experience pricing is generally segmented no further than day of week and time slot, and the design of cutting price in low-demand windows to hold utilisation is not yet refined. The form of the discount matters too.

What Disney used this summer was not a broad cut but narrow targeting — a $50 ticket for children aged three to nine — and the reason to visit came from a dormant theater space and refreshed existing attractions rather than new construction. That sequence, designing repeat visits without new capital, is the more usable reference for Korean operators working to a fixed budget.

One more sits alongside it. In the P&L of Korean streaming services and broadcasters, sports and performance rights have been treated purely as cost. Peacock carried first-year NBA rights costs and still turned a quarterly profit while adding two million subscribers — which argues for converting rights spend into a subscriber acquisition cost per head.

Running the same event through streaming and through group exhibition at a venue creates two recovery points from one purchase of rights. For Korean operators, that combination remains untried.

The last item is measurement. In the U.S. market, PwC counts revenue by segment, Kagan counts rights payments and EntTelligence counts premium screen share, and investment decisions rest on those numbers. Korea has box office and performing arts ticketing systems, but immersive exhibitions, experience venues and venue advertising inventory fall outside them. Municipalities and operators keep evaluating the same facilities without a public indicator of market size or spend per head.


Sources

1. Axios, "Live events boom as counter to AI disruption" (Kerry Flynn and Sara Fischer, August 2026) — primary source for this article

2. Axios, "Change in select entertainment stocks" chart (Financial Modeling Prep data, Aug. 2, 2021–Aug. 3, 2026) — underlying data for the stock graphic

3. Axios, "Annual U.S. live media and entertainment revenue" chart, citing PwC Global Entertainment, Media & Telecoms Outlook 2021-2030 — underlying data for the segment revenue graphic

4. Axios, "Live event companies see momentum as experiences boom" (Sara Fischer, June 2, 2026) — https://www.axios.com/2026/06/02/live-experience-movies-entertainment-stocks

5. The Athletic, "$20 million college football jersey patches, plus vintage NCAA silliness" (Jason Kirk, Aug. 1, 2026) — https://www.nytimes.com/athletic/7483453/2026/07/31/jersey-patches-college-football-until-saturday/

6. FOX 35 Orlando, "Universal reports 'softened' attendance at Orlando theme parks" (Ashley Carter, July 23, 2026) — https://www.fox35orlando.com/news/universal-reports-softened-attendance-orlando-theme-parks

7. Restaurant Business, "A tough economy dampens the fun at Dave & Buster's" (Joe Guszkowski, June 16, 2026) — https://www.restaurantbusinessonline.com/financing/tough-economy-dampens-fun-dave-busters

8. Inside the Magic, "Disney World Confirms Lightning Lane Cuts Beginning September 1 at All Four Theme Parks" (Thomas Hitchen, Aug. 11, 2026) — https://insidethemagic.net/2026/08/official-disney-world-confirms-lightning-lane-cuts-beginning-september-1-th1/

9. CNN, "Disney parks and cruises saw their best growth in two years despite a travel slowdown" (Natasha Chen, Aug. 13, 2026) — https://edition.cnn.com/2026/08/13/business/disney-parks-cruises-growth

10. Axios Tampa Bay, "Dueling Van Gogh exhibits cause confusion across America" (Selene San Felice and Felix Salmon, April 22, 2021) — https://www.axios.com/local/tampa-bay/2021/04/22/van-gogh-exhibit-immersive-scam-real

11. Kagan, S&P Global Market Intelligence, "Sports rights in the US to reach $37 billion by 2030" (Scott Robson) — U.S. $29.25bn in 2025 against $14.64bn in 2015; global $57.2bn; 96 local rights deals

12. United Parks & Resorts second quarter 2026 — attendance -2.9%, revenue -1.4%

13. The Walt Disney Company third-quarter results — Experiences revenue $9.97bn (+10%), domestic park attendance +3%, per-capita spending +4%

14. Dave & Buster's first-quarter 2026 results and earnings call — same-store sales -5.4%, revenue $559.2m, net income $5.7m, 247 North American locations

15. Comcast second-quarter 2026 earnings materials, Content & Experiences — Theme Parks $2,413m (+2.7%) and adj. EBITDA $609m (-5.1%); Media $5,691m (+25.3%); Studios $3,040m (+25.0%); Peacock EBITDA $189m and 48m paid subscribers

16. Axios, "Change in select theater and live entertainment stock prices" chart (Financial Modeling Prep data, Jan. 2 to June 2, 2026) — underlying data for the year-to-date graphic

17. Cinemark press release, record domestic May box office (June 1, 2026) — https://ir.cinemark.com/news-events/press-releases

18. AMC Entertainment press release, best-attended May since 2019 (2026) — https://investor.amctheatres.com/news-events/press-releases

19. The Wall Street Journal, "IMAX Is Exploring a Sale" (Ben Fritz and Jessica Toonkel, May 21, 2026) — https://www.wsj.com/business/media/imax-is-exploring-a-sale-7d01c45a

20. Box Office Mojo (domestic box office of about $2.9bn) and EntTelligence (premium screen share of 16%), as cited by the WSJ

21. PwC, "Global entertainment and media advertising revenues to hit US$1.4 trillion in 2030 – as global box office continues recovery" (June 22, 2026) — https://www.pwc.com/gx/en/news-room/press-releases/2026/pwc-2026-global-entertainment-media-outlook.html

22. PwC, Global Entertainment & Media Outlook 2026-30, insights and perspectives — https://www.pwc.com/gx/en/issues/business-model-reinvention/outlook/insights-and-perspectives.html

23. BizTechReports, summary of PwC Outlook 2026-30 (trade shows $38bn to $44.6bn), July 2026

24. The Luxe Review, "Global entertainment revenues to reach $4.2 trillion by 2030" (June 22, 2026) — global four-segment live spending of $294bn

25. National CineMedia, "National CineMedia, Inc. to Acquire Captivate for $275 Million" (Aug. 11, 2026) — https://www.ncm.com/post/national-cinemedia-inc-to-acquire-captivate-for-275-million-creating-the-leading-premium-video-a

26. Business Wire and SEC Form 8-K, same announcement — https://www.sec.gov/Archives/edgar/data/0001377630/000119312526344631/ncmi-ex99_1.htm

27. Deadline, "National CineMedia To Acquire Captivate For $275M" (Aug. 11, 2026)

28. National CineMedia second-quarter 2026 results — revenue $58.4m (+12.7%), local advertising $9.5m (+48.4%)

29. CNBC, "IMAX has held 'preliminary talks' with potential buyers, source says" (May 21, 2026) — https://www.cnbc.com/2026/05/21/imax-preliminary-talks-potential-buyers.html

30. Sportico, "Fanatics, New Era, SeatGeek Lead List of IPO Maybes in 2026" (January 2026) — SeatGeek's confidential April 2023 IPO filing

31. Ministry of Culture, Sports and Tourism and Korea Arts Management Service, 2025 Performing Arts Ticket Sales Report (March 2026) — http://www.gokams.or.kr

32. Korean Film Council, 2025 Korean Film Industry Review (Feb. 27, 2026) — http://magazine.kofic.or.kr

* Stock changes are read from the original chart and rounded. Figures should be re-checked before publication.