

STREAMING · FAST · AD MEASUREMENT
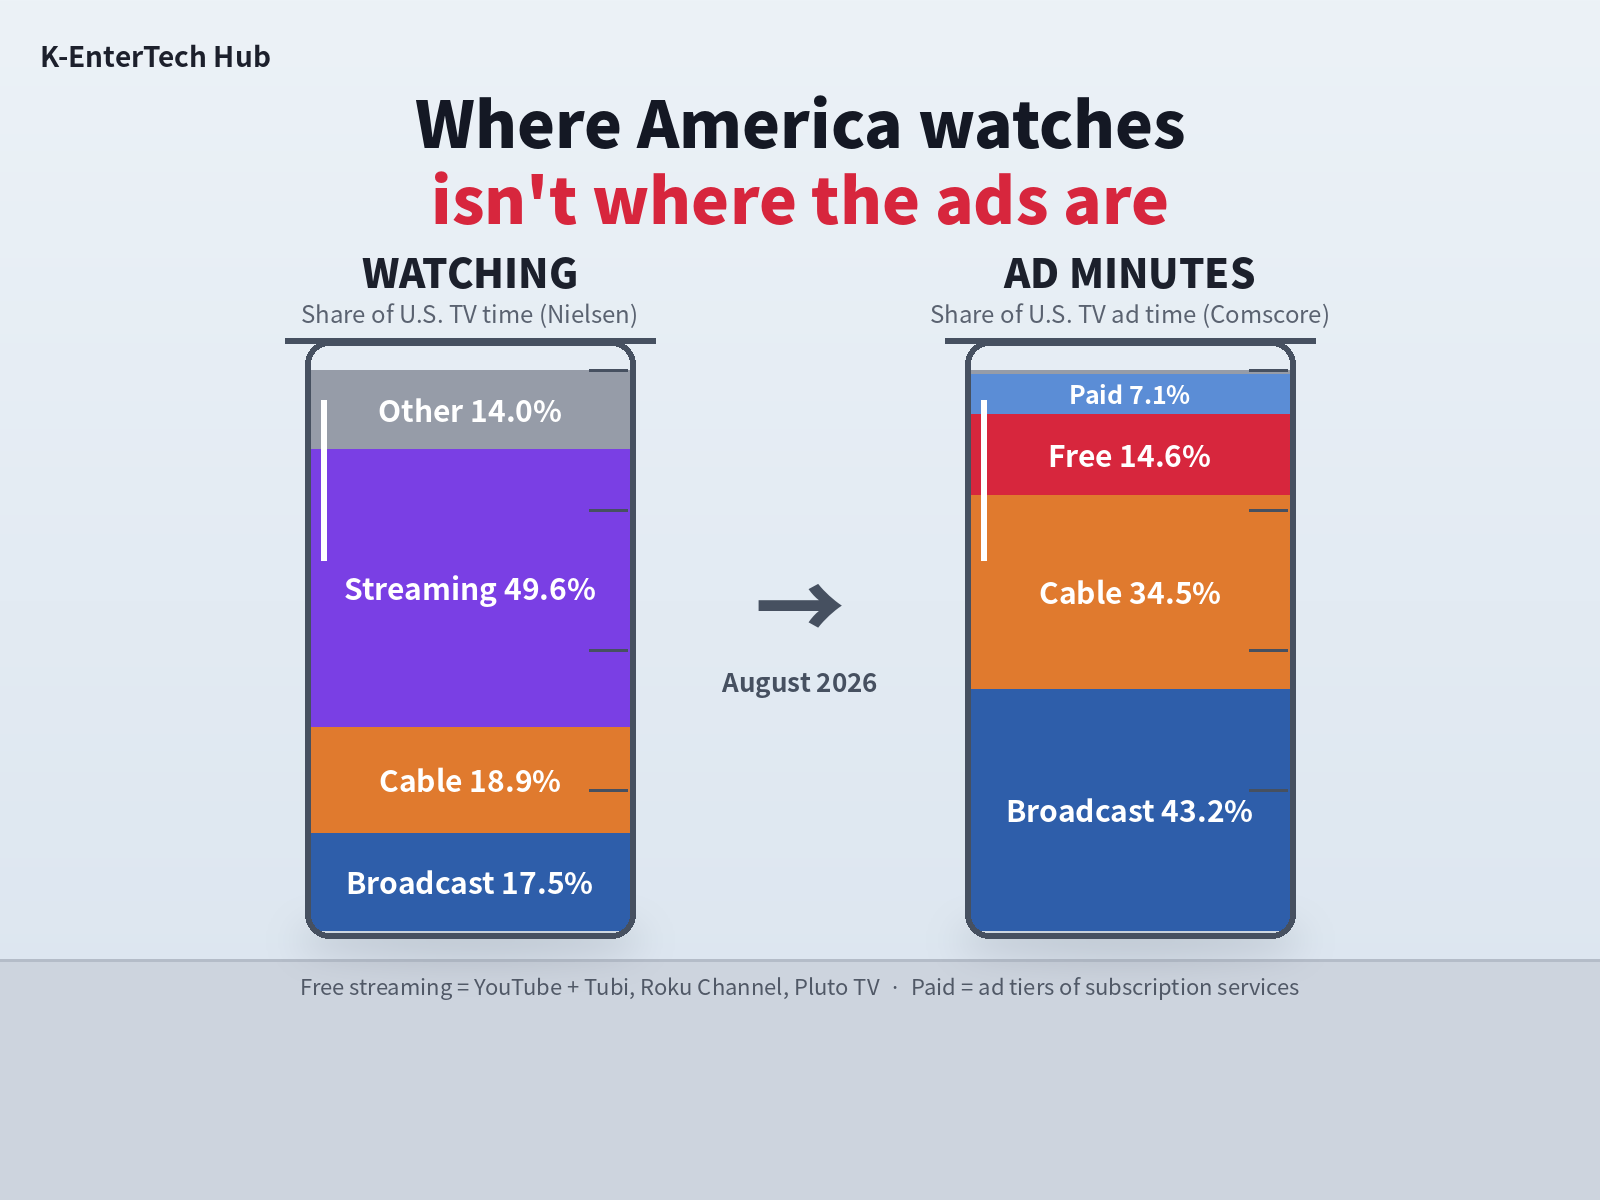
Comscore’s first Score Report: streaming took 49.6% of U.S. TV viewing in August but 22.3% of ad exposure time — and YouTube, Tubi, The Roku Channel and Pluto TV supplied two-thirds of that.
Graphic: K-EnterTech Hub
Half of the time Americans spend in front of the TV now goes to streaming. Count instead the minutes in which ads actually appeared on screen, and streaming’s share shrinks to just over a fifth — and two-thirds of that goes to free services: YouTube, Tubi, The Roku Channel and Pluto TV. That is the map of the U.S. TV ad market drawn by The Score Report, a new monthly release that measurement company Comscore published for the first time on Wednesday.
The report breaks down share of ad exposure time by platform, network, company and local market. In its first edition, covering the August 2026 broadcast month, broadcast took 43.2% of U.S. TV ad exposure time, cable 34.5% and streaming 22.3%. That is the mirror image of Nielsen’s August Gauge, released a day later, in which streaming took 49.6% of viewing. Broadcast ran the other way, with 17.5% of viewing and 43.2% of ad time.
Inside streaming, the center of gravity is even clearer. YouTube accounted for 44.4% of streaming ad exposure time. Add the free, ad-supported streaming TV (FAST) services Tubi (11.6%), The Roku Channel (6.6%) and Pluto TV (2.9%), and free services supplied 65.5% of streaming’s ad minutes. The ad tiers of six paid services — Hulu, Prime Video, Netflix, Peacock, Disney+ and Paramount+ — supplied 32.0% between them; Netflix’s share was 6.3%. Among individual services, only Tubi had a larger share of ad time (about 2.6%) than of viewing (1.9%).
The split follows the business model. Every minute watched on a free service carries ads; viewing on an ad-free paid tier carries none. “We’re calling it share of ad time, but essentially add up every minute of advertising that a consumer is exposed to across broadcast, cable and streaming in a broadcast month,” Kevin Burns, Comscore’s chief of staff and interim chief revenue officer, told Digiday. The numbers make plain that what the ad market actually trades is not viewing time but minutes in which ads are seen.
That matters in South Korea. An amended decree raising the daily cap on broadcast advertising from 17% to 20% of airtime took effect on Oct. 16, after broadcast ad spending fell an estimated 13.8% in 2025 to 2.77 trillion won ($2.09 billion). In June the Korea Communications and Media Commission (방송미디어통신위원회, KCMC) convened broadcasters and TV makers to push Korean FAST channels as an overseas ad-revenue route. Korean broadcasters now have to prove two things at once: at home, that the extra ad minutes are watched; abroad, that they can sell ad minutes in a FAST market.
Streaming leads viewing, broadcast leads ads: U.S. TV recounted by ads seen
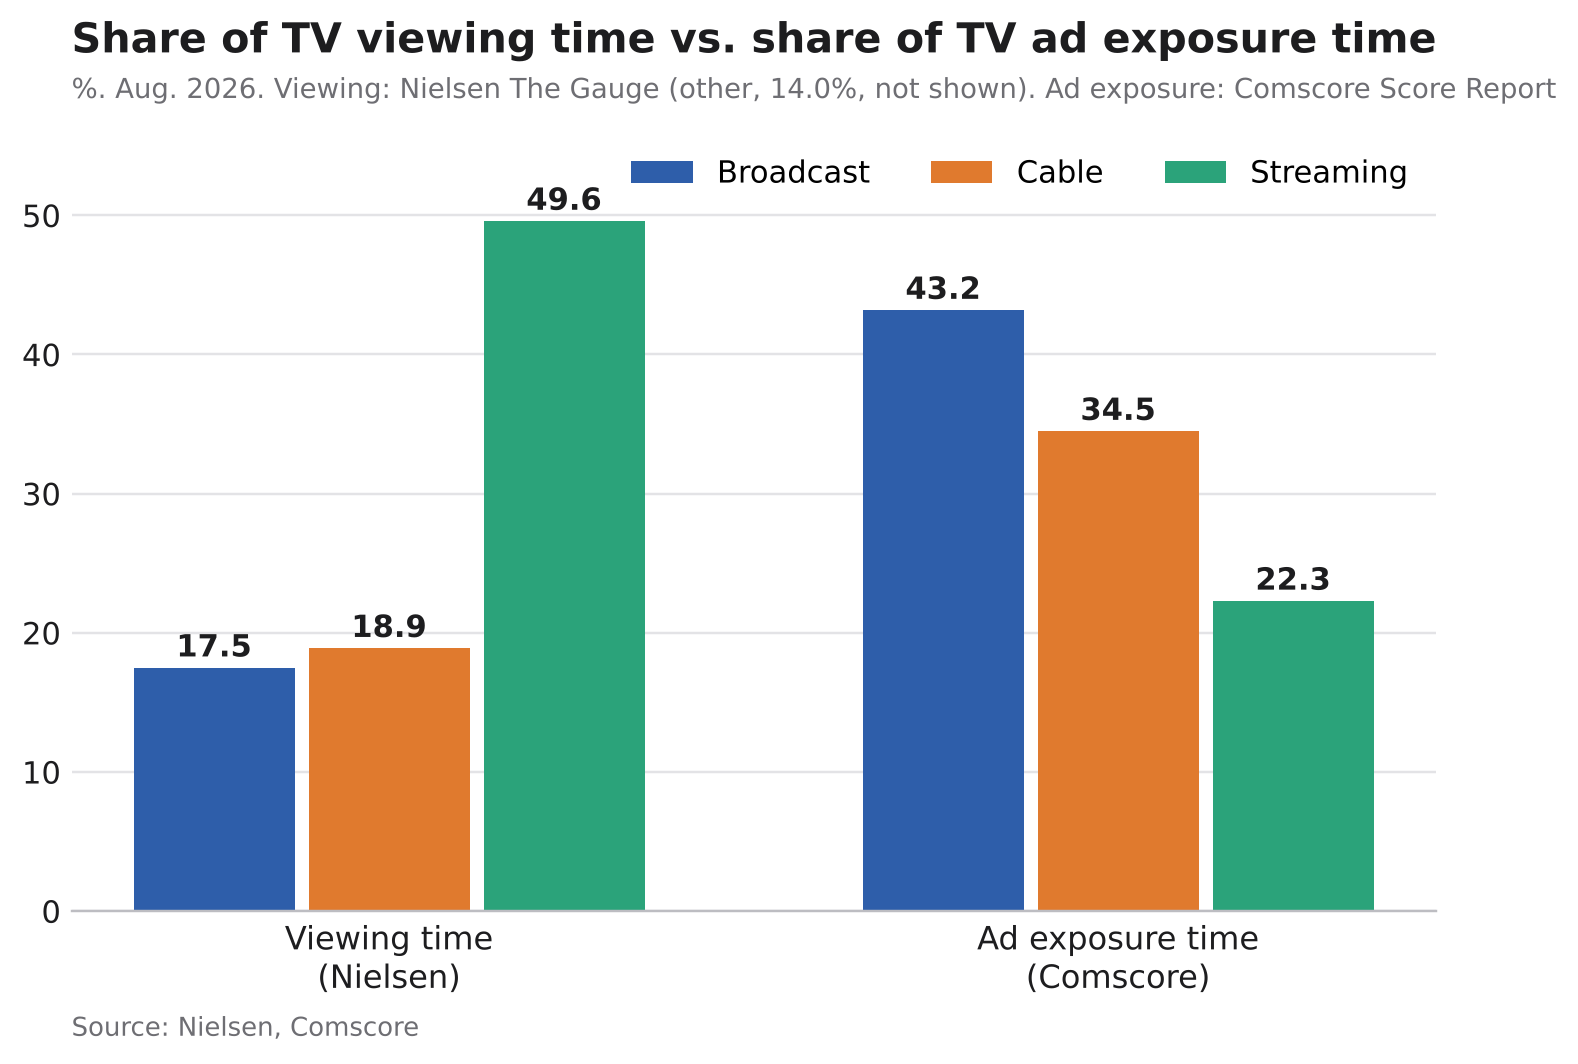
Both reports cover the August 2026 broadcast month. The Gauge measures viewing by persons 2+, including ad-free viewing; the Score Report measures household ad exposure. Nielsen’s ‘other’ category (14.0%) is not shown. Source: Nielsen, Comscore
The two reports measure the same August with different yardsticks. According to the report’s FAQ, share of ad exposure time is a publisher’s, platform’s or owner’s portion of all measurable TV ad viewing in a broadcast month, compiled from Comscore’s linear and streaming measurement. It covers national and local ads on broadcast networks, cable networks and streaming services across the 210 local markets Comscore tracks. Each monthly report covers one four- or five-week broadcast month; the October report covers August. The data come from Comscore’s TV currency product and automatic content recognition, Digiday reported.
Only in-home TV sets count — smart TVs and TV-connected streaming devices. Desktops, laptops, phones and tablets are excluded. Ads seen through virtual pay-TV services such as YouTube TV, Sling and Hulu Live are credited to the originating network: “An ad shown on NBC viewed through YouTube TV is credited to NBC rather than YouTube,” the FAQ says. Streaming’s 22.3% therefore excludes linear channels delivered over the internet. Nielsen also assigns vMVPD viewing to broadcast and cable.
Nielsen’s August Gauge (July 27–Aug. 30, five weeks) put streaming at 49.6%, cable at 18.9% and broadcast at 17.5%. With the World Cup over, total TV usage fell 4.4% from July and broadcast usage fell 14%; sports dropped from 30% of broadcast viewing in July to under 9%. Nielsen says the Gauge does not reflect its currency ratings, and that starting with September it will make a one-time methodology adjustment and publish the September and October intervals together later this year.
Comscore is upfront about the metric’s limits. It does not measure ad inventory, ad slots, ad spend, unique reach or frequency, and a higher share does not by itself indicate better ad effectiveness or viewer experience. Only shares are published, so a rising share could coincide with a shrinking pool of ad minutes, PPC Land noted.
YouTube 44.4%, FAST 21.1%: Tubi the only service with more ads than viewing
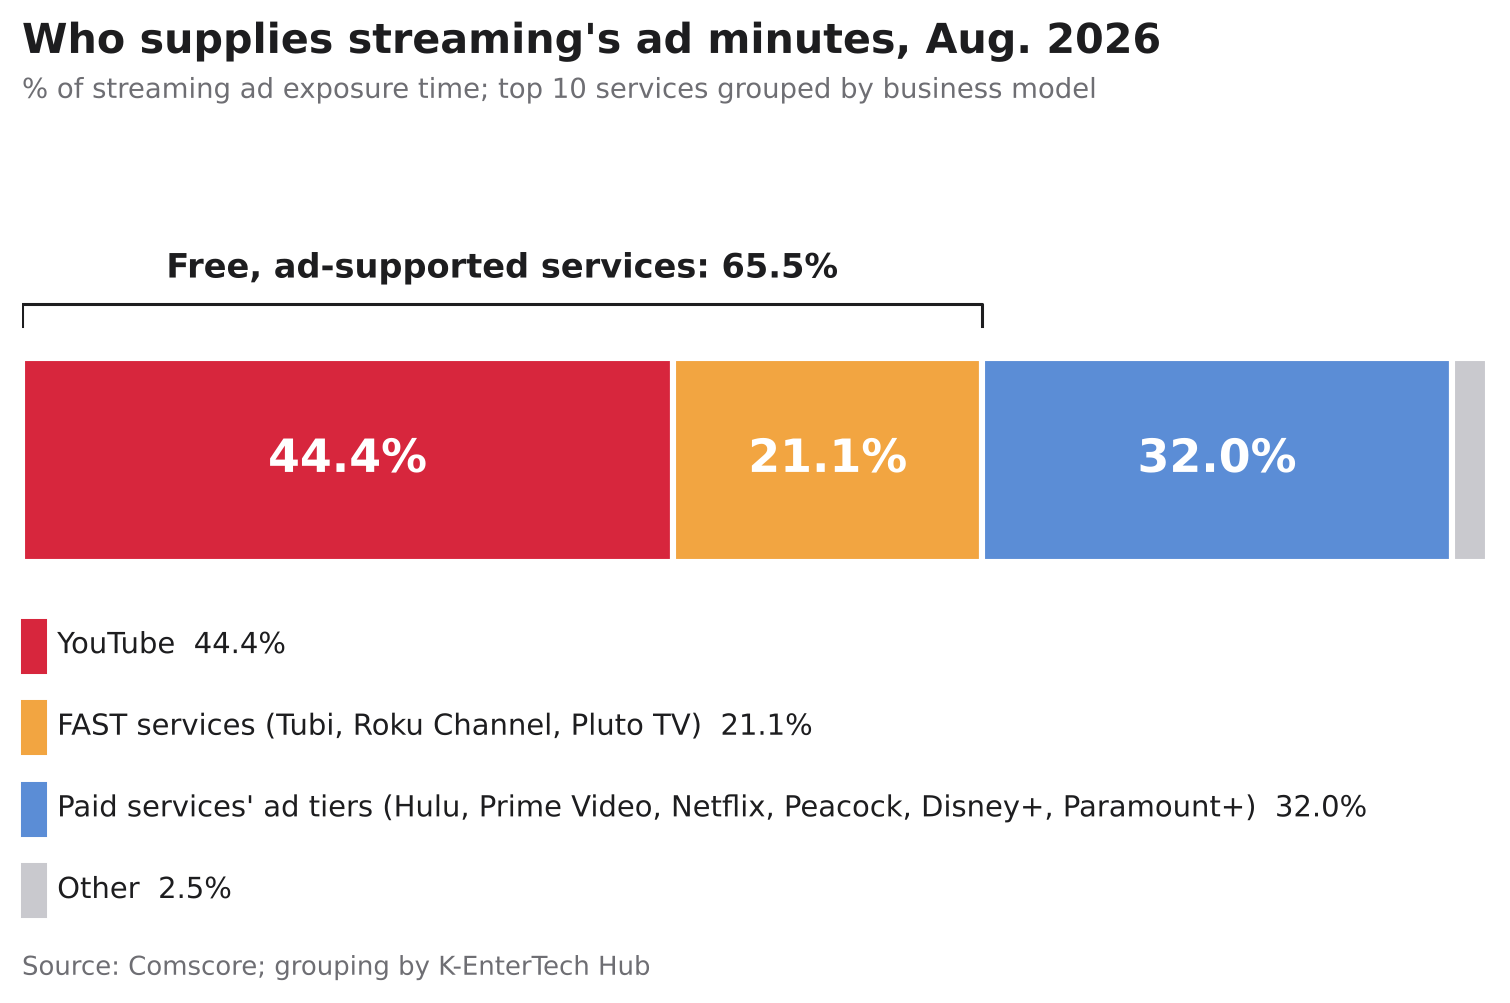
The top 10 services grouped by business model. Tubi, The Roku Channel and Pluto TV are free, ad-supported services with FAST channels and on-demand libraries. Source: Comscore; grouping by K-EnterTech Hub
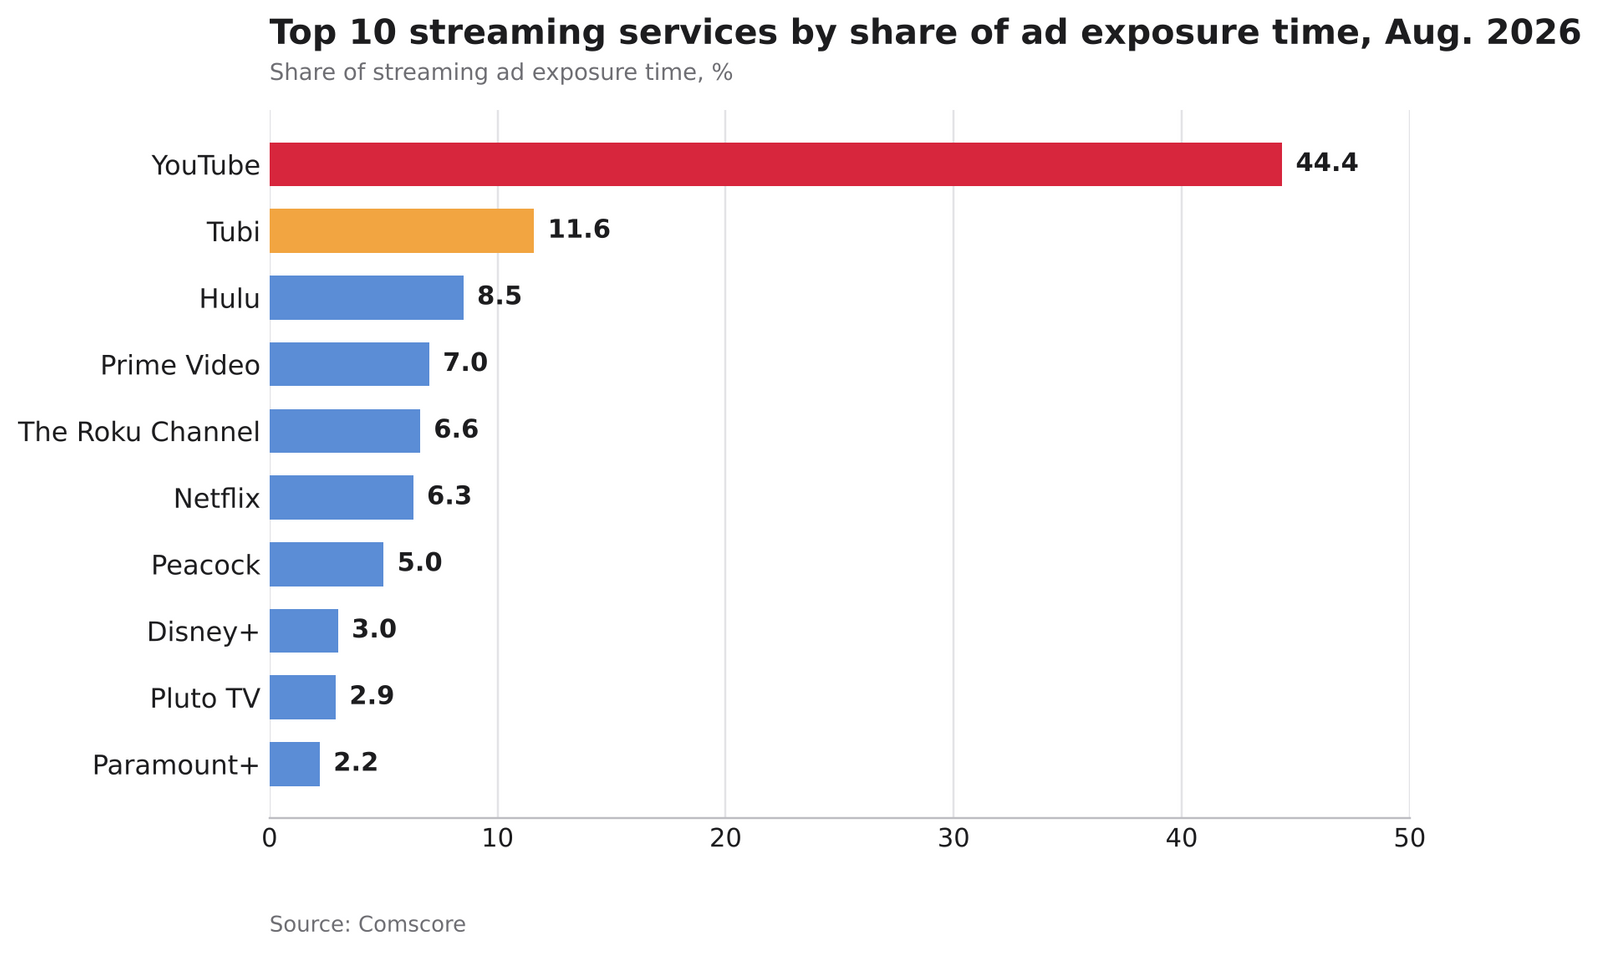
YouTube excludes YouTube TV. The top 10 account for 97.5% of streaming ad exposure time. Source: Comscore
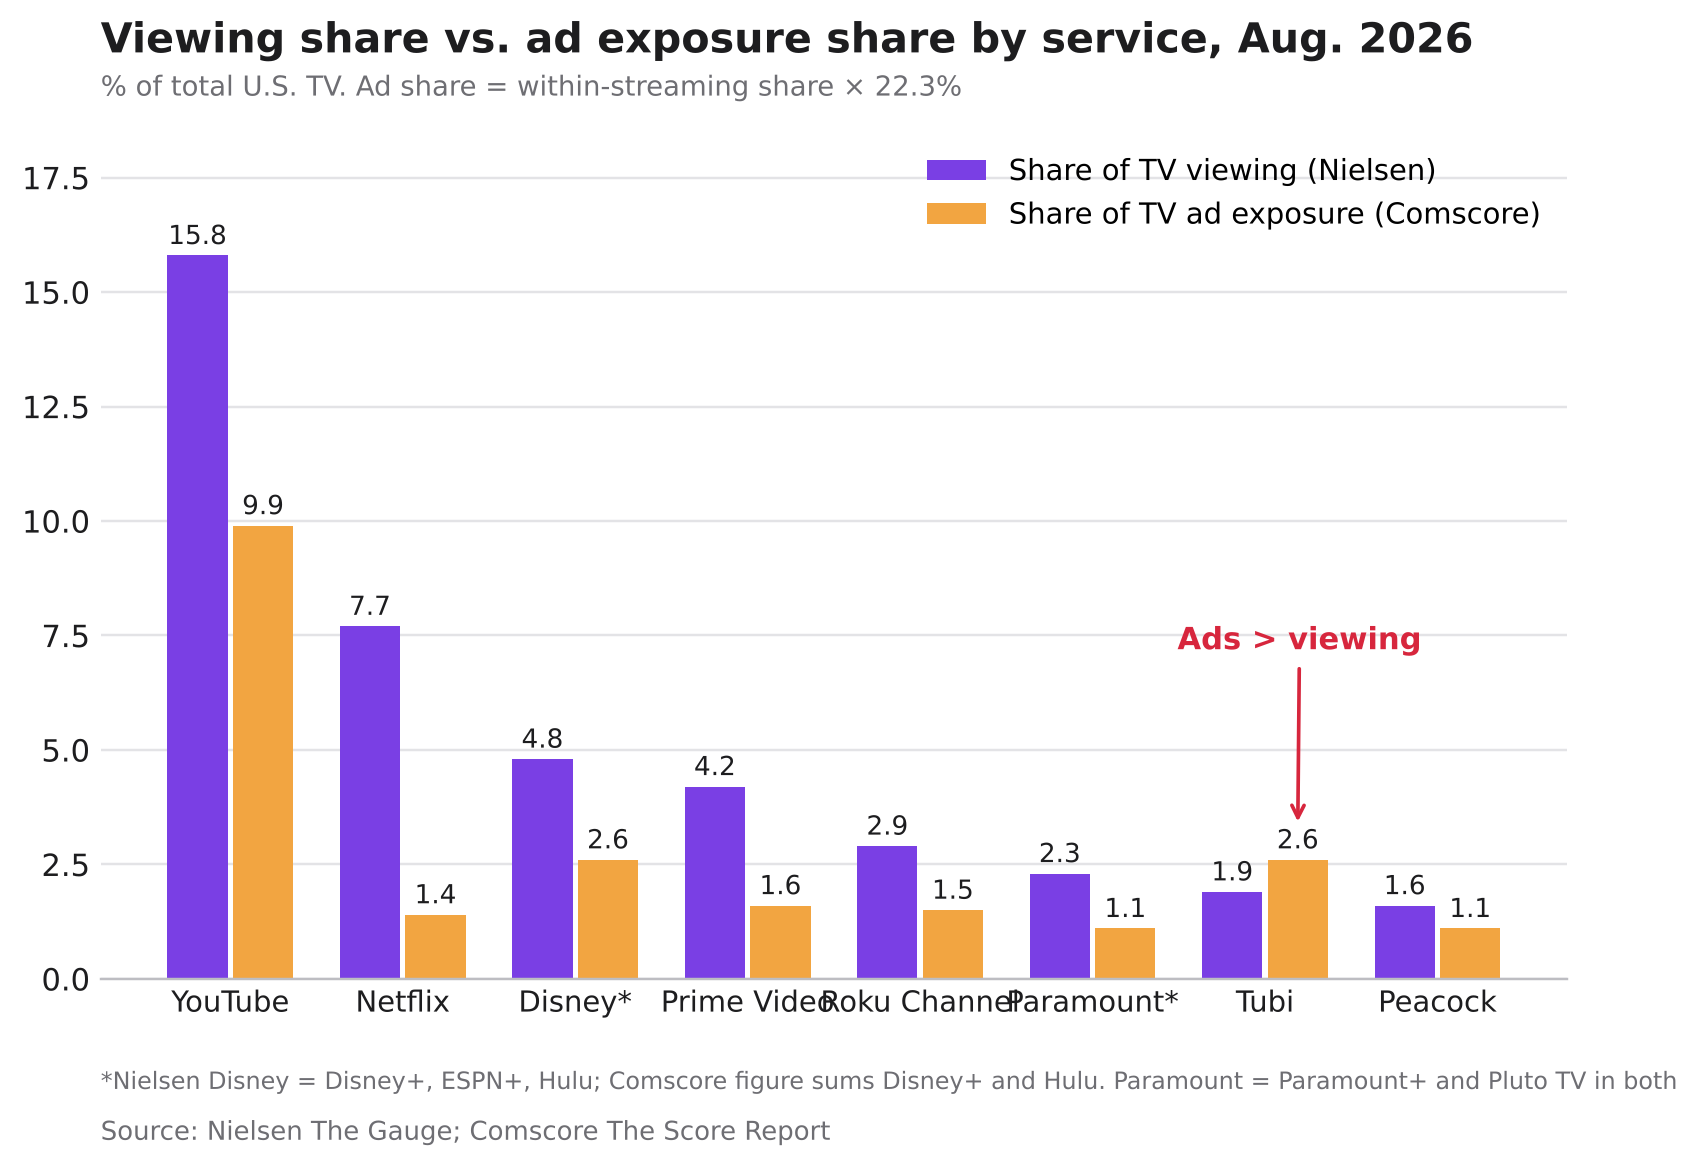
Viewing and ad exposure shares for the same month, both expressed as a share of total U.S. TV. Only Tubi’s ad share exceeds its viewing share. Source: Nielsen; Comscore
At the service level, FAST’s position comes into focus. In Nielsen’s August Gauge, YouTube held a record 15.8% of TV viewing, followed by Netflix (7.7%), Disney (Disney+, ESPN+ and Hulu; 4.8%), Prime Video (4.2%), The Roku Channel (2.9%), Paramount (Paramount+ and Pluto TV; 2.3%), Tubi (1.9%) and Peacock (1.6%). Multiplying Comscore’s within-streaming shares by streaming’s 22.3% gives each service’s share of all TV ad time: YouTube about 9.9%, Tubi 2.6%, Disney+ and Hulu 2.6%, Prime Video 1.6%, The Roku Channel 1.5%, Netflix 1.4%, Paramount+ and Pluto TV 1.1%, and Peacock 1.1%.
Per point of viewing share, Tubi delivers about 1.4 points of ad share, against 0.6 for YouTube, around 0.5 for The Roku Channel, Disney and Paramount, 0.4 for Prime Video and 0.2 for Netflix. Tubi draws a quarter of Netflix’s viewing and nearly twice its ad time. The Roku Channel, also a FAST service, came in at 2.9% of viewing and 1.5% of ad time, a ratio of 0.5; Nielsen reports Pluto TV together with Paramount+, so a Pluto-only ratio cannot be calculated. Together the three FAST services account for about 4.7% of all U.S. TV ad time — two-thirds of the 7.1% held by the six paid services’ ad tiers.
The financials point the same way. Tubi’s revenue rose 35% and its total view time 17% in Fox’s fiscal fourth quarter (April–June), TheWrap reported, and it ended the fiscal year with 110 million monthly active users. Fox CEO Lachlan Murdoch said on the earnings call that Tubi’s revenue is now 10 times what it was at acquisition. Roku, which runs The Roku Channel, grew second-quarter platform revenue 25% to $1.22 billion (about 1.62 trillion won), with streaming hours up 7% to 37.9 billion, eMarketer noted. Comscore’s own 2025 State of Streaming report had found total hours on major free ad-supported services up 43% year over year in August 2025.
Free does not automatically mean ad time. Samsung TV Plus, which passed 100 million monthly users worldwide in February, did not appear in this month’s top 10. Rankings near the top swung with programming and big events: third place changed hands every month — Prime Video in May (7.4%), Netflix in June (8.0%), Peacock in July (7.2%) and Hulu in August (8.5%), which Comscore tied to a wave of films and documentaries added to Hulu’s ad-supported catalog. In June, Peacock, Tubi and Fox One all gained share, likely on the World Cup, a Comscore spokesperson told Digiday; Tubi drew 20 million viewers over the tournament.
Paid services add ads: Netflix up from 1.40 to 2.44 minutes an hour
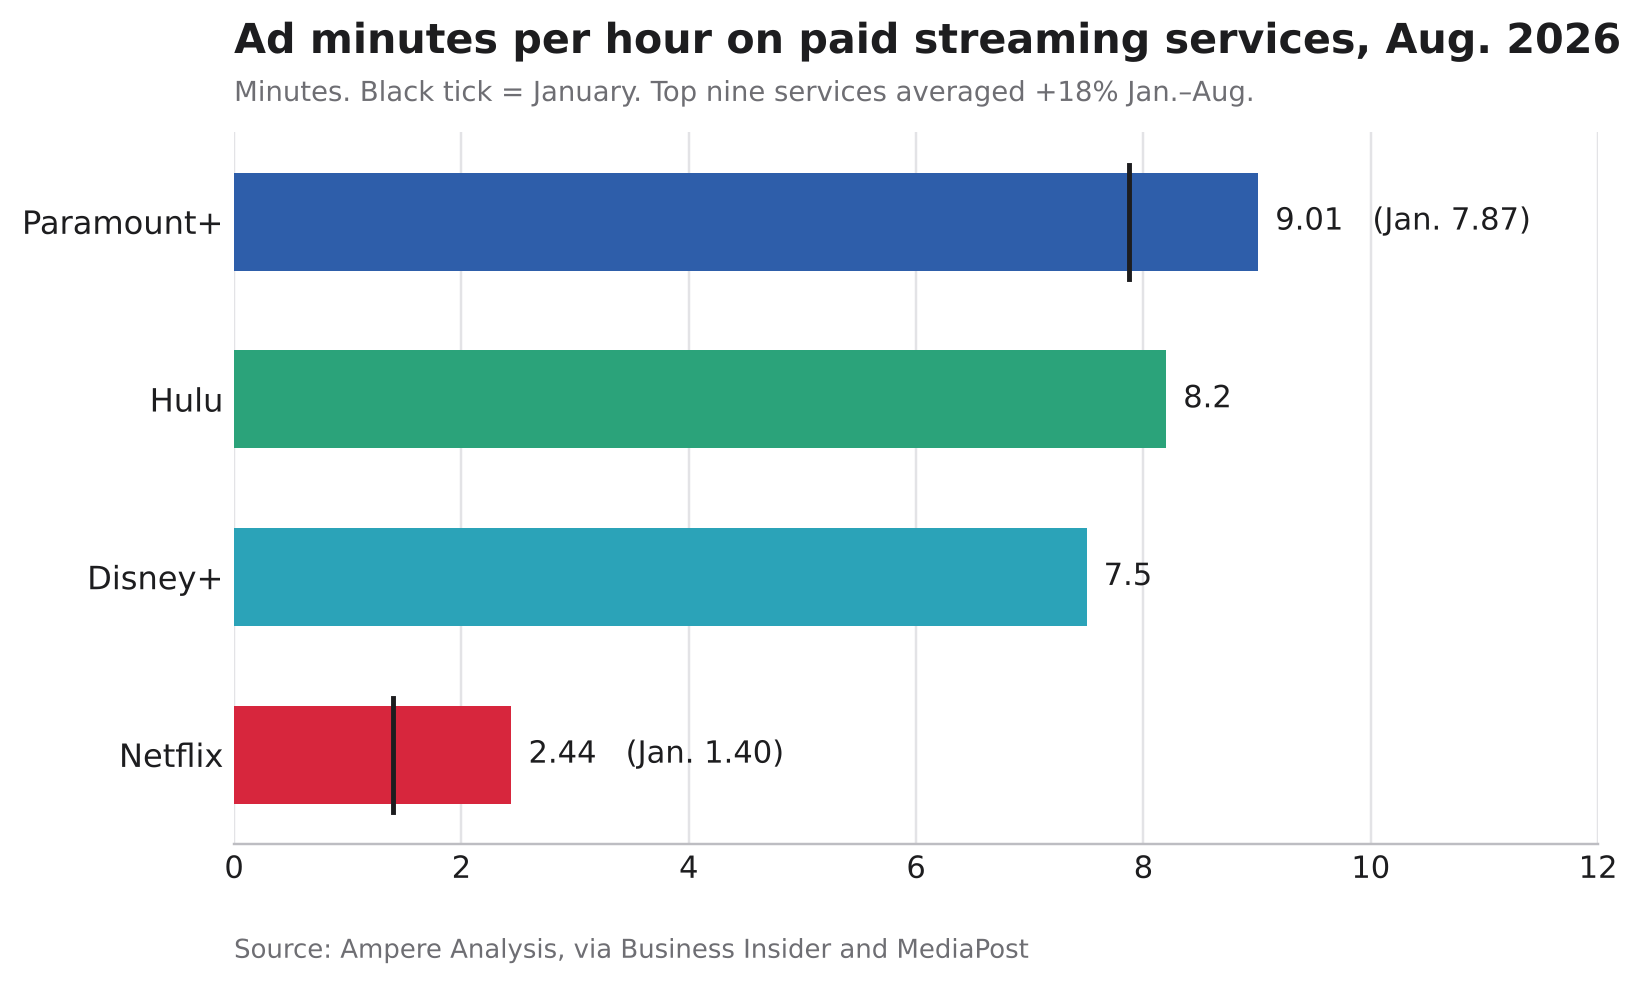
Ad tiers of paid services are carrying more commercial minutes. Source: Ampere Analysis, via Business Insider and MediaPost
Paid services are narrowing the gap by carrying more ads per hour. Ad minutes per hour across the top nine premium streaming services rose 18% on average between January and August, according to Ampere Analysis data shared with Business Insider. Paramount+ went from 7.87 to 9.01 minutes and Netflix from 1.40 to 2.44, eMarketer reported; in August Hulu ran 8.2 minutes and Disney+ 7.5, MediaPost reported.
That raises the worry that a ranking built on ad time could encourage heavier ad loads. Digiday’s Tim Peterson floated the reverse: average hourly ad load per viewer, scored like golf, lowest first. Burns countered that Comscore sees itself as “the scorekeeper and not a commentator in the booth,” and that its aim is to present the data and let others draw their own conclusions.
FAST viewing up 55%, ad impressions up 53% — ads cluster in North America and news
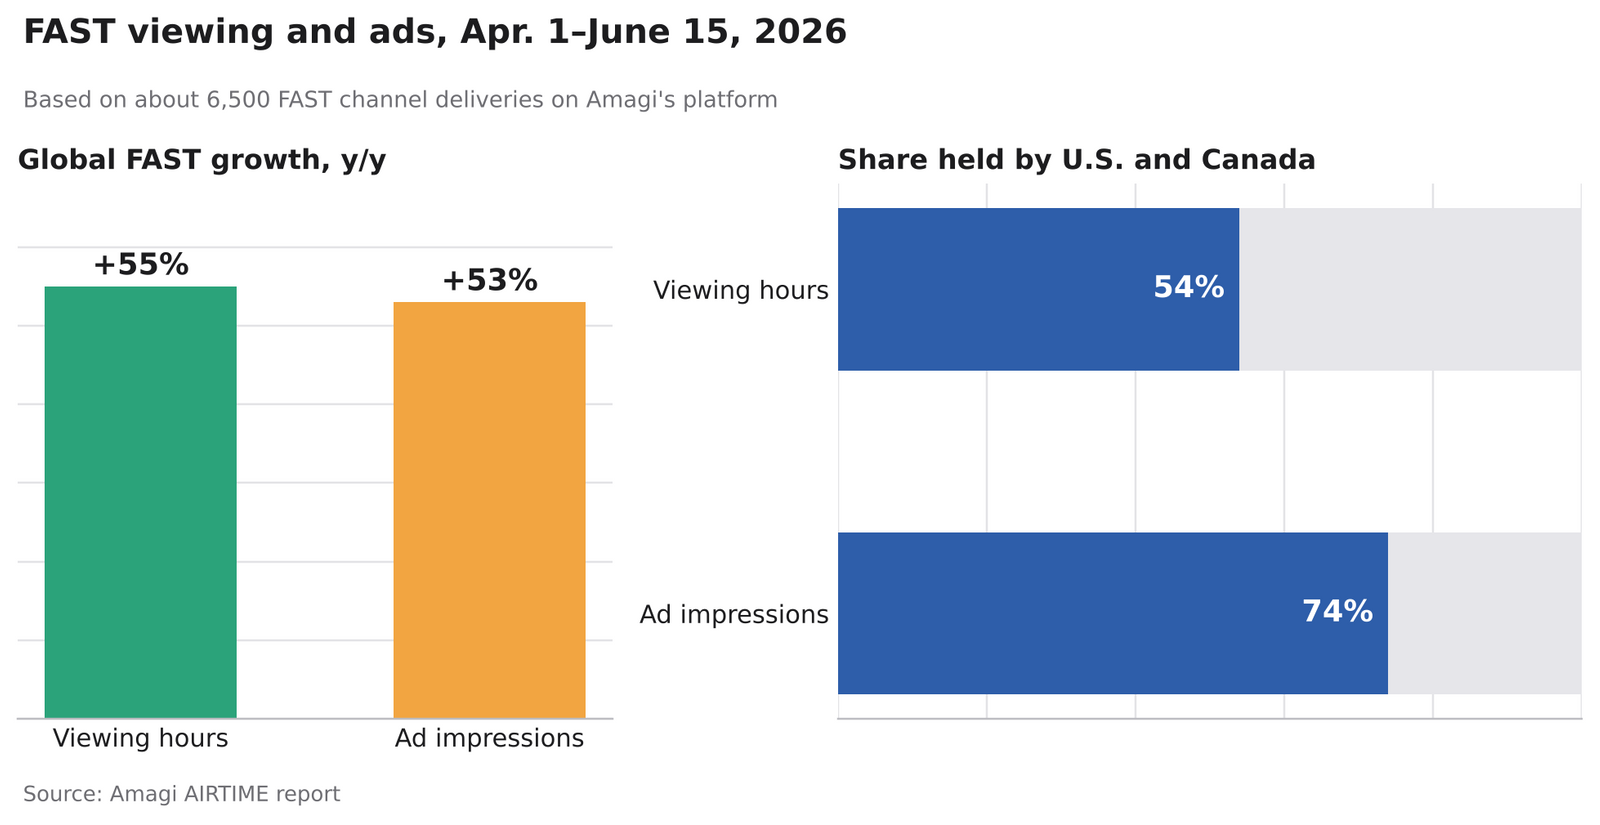
FAST ad impressions are more concentrated in North America than viewing. Source: Amagi AIRTIME report
The wider FAST market shows the same pattern. Across about 6,500 FAST channels delivered on its platform, viewing hours rose 55% and ad impressions 53% year over year between April 1 and June 15, Amagi said in its July 1 AIRTIME report. The U.S. and Canada accounted for 54% of viewing hours and 74% of ad impressions, so ads were even more concentrated in North America than viewing; Latin America grew fastest, with viewing up 190%.
News took 27% of viewing and 33% of ad impressions, more ads than its viewing share; entertainment took 41% and 40%. The survey also exposed an operational bottleneck: of 28 practitioners, 86% said reformatting metadata for each platform was their biggest operational drag and 86% said poor metadata was costing them money. “The next competitive edge isn’t reach; it’s operational precision,” said Srinivasan KA, Amagi’s co-founder and president of global business.
Streaming up 6.2 points in a year; broadcast gave ground over the summer
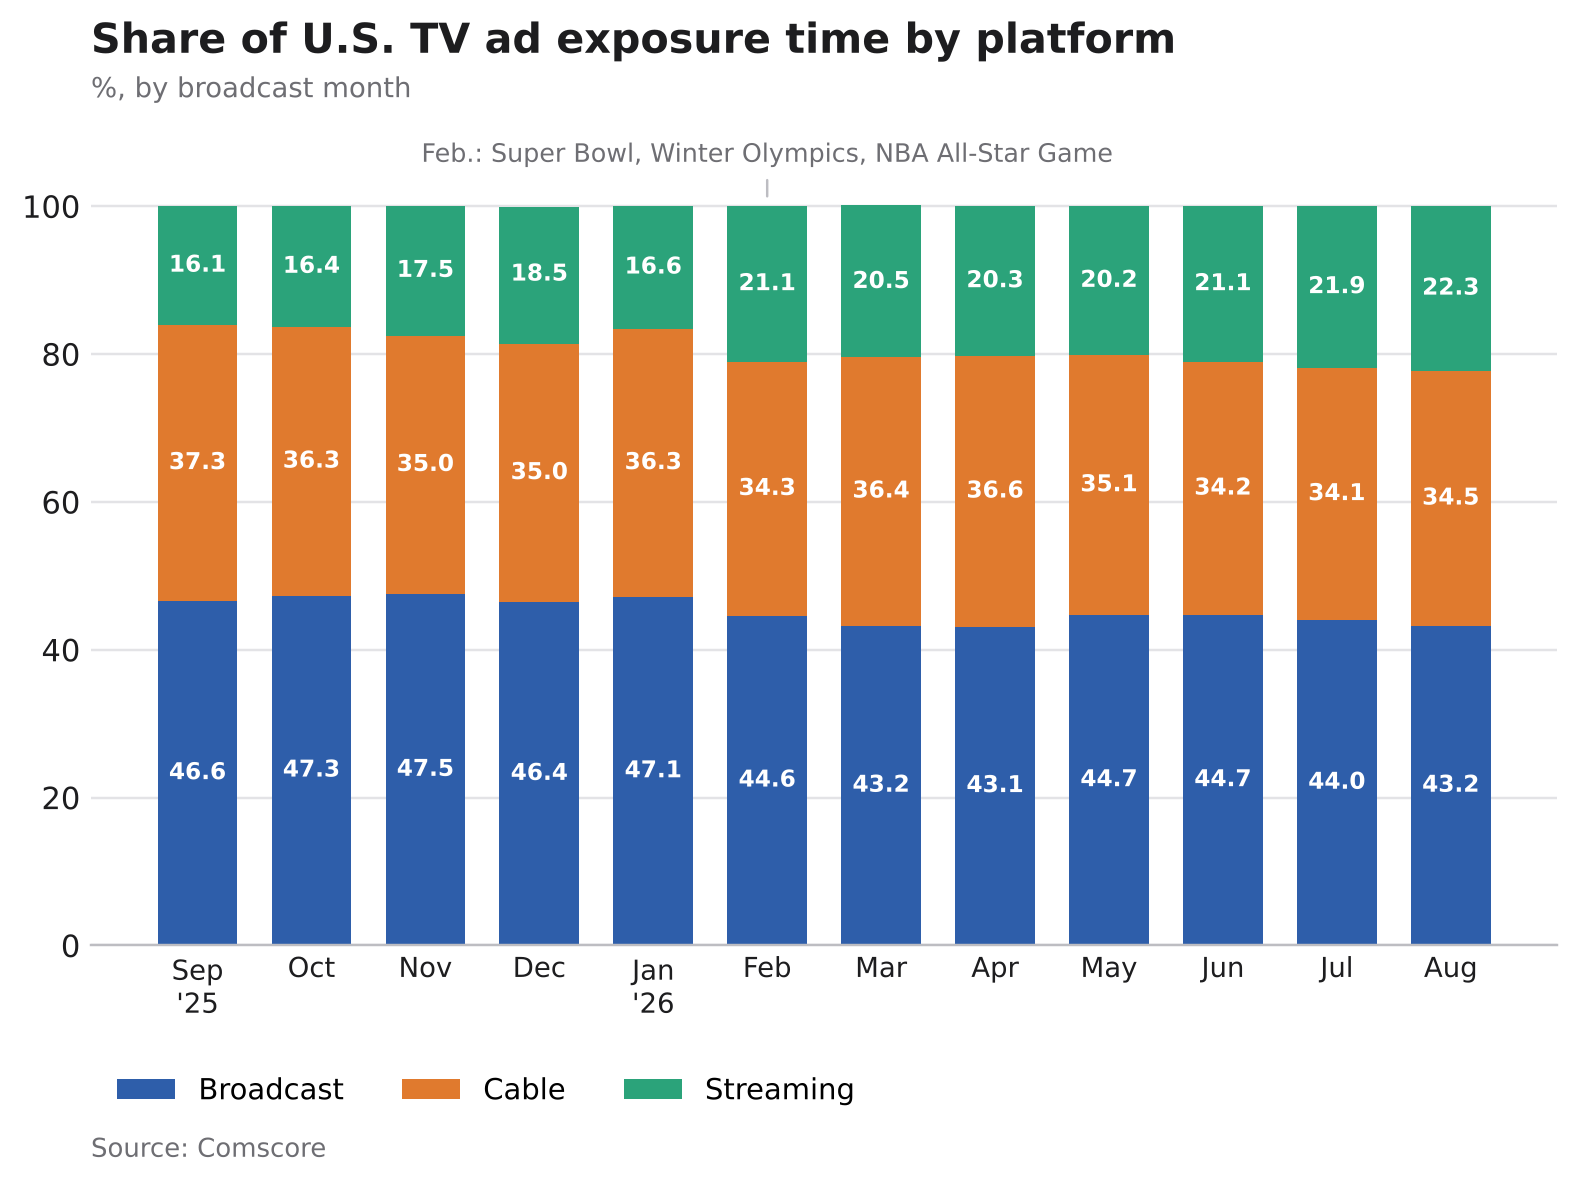
Streaming has held at least a fifth of ad time every month since February; its June–August gains coincided with a fall in broadcast’s share. Source: Comscore
Streaming’s share of ad time rose from 16.1% in September 2025 to 22.3% in August 2026. Broadcast fell from 46.6% to 43.2% and cable from 37.3% to 34.5%. The turning point was February. Streaming jumped to 21.1% in the month NBCUniversal branded “Legendary February,” when the Super Bowl, the Milan Cortina Winter Olympics and the NBA All-Star Game were broadcast on NBC and streamed on Peacock.
Comscore’s reading and its numbers do not always line up. It described a plateau near 19% in the five months before February, but its own chart shows 16.1% to 18.5% in that span, PPC Land noted. Comscore also says streaming is gaining from cable, but between June and August cable rose from 34.2% to 34.5% while broadcast fell from 44.7% to 43.2%.
Big three networks and Fox News hold linear; local stations depend on who gets credit
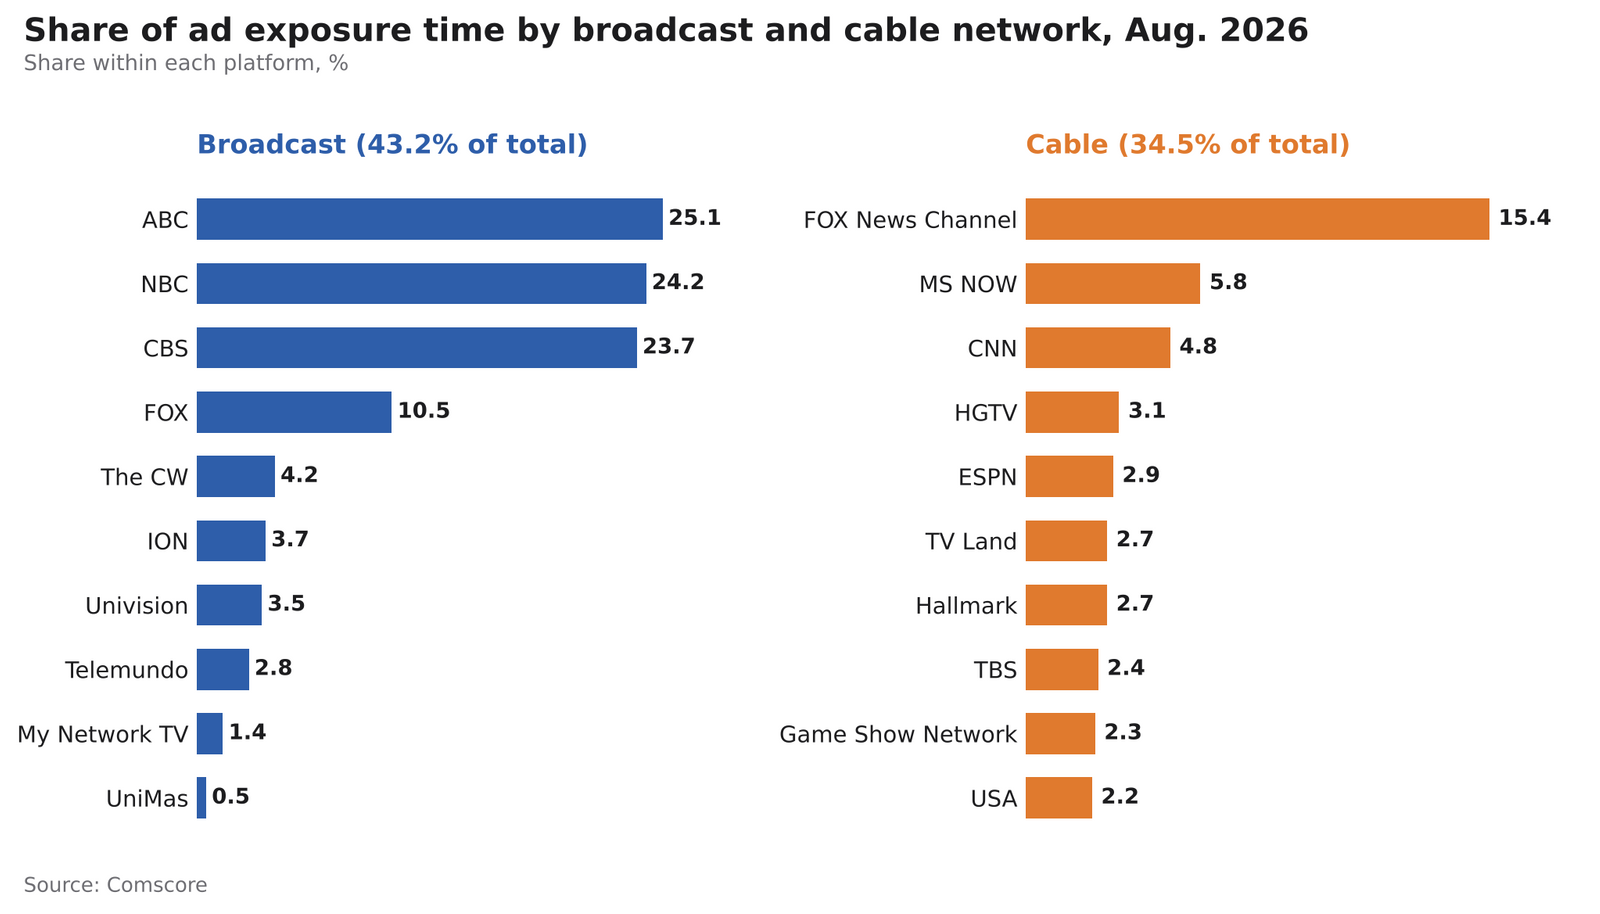
The big three networks split broadcast ad time almost evenly; news leads cable. Source: Comscore
Within linear TV, the big three networks and news channels held their ground. ABC took 25.1% of broadcast ad time, NBC 24.2%, CBS 23.7% and Fox 10.5%. In cable, Fox News Channel held 15.4%, nearly three times MS NOW’s 5.8%, which works out to about 5.3% of all U.S. TV ad time — twice Tubi’s. News was the largest cable genre in Nielsen’s August Gauge, at 25% of cable viewing. Anyone who sat through the gambling ads during this year’s MLB playoffs, Peterson wrote, may find the ranking dead-on.
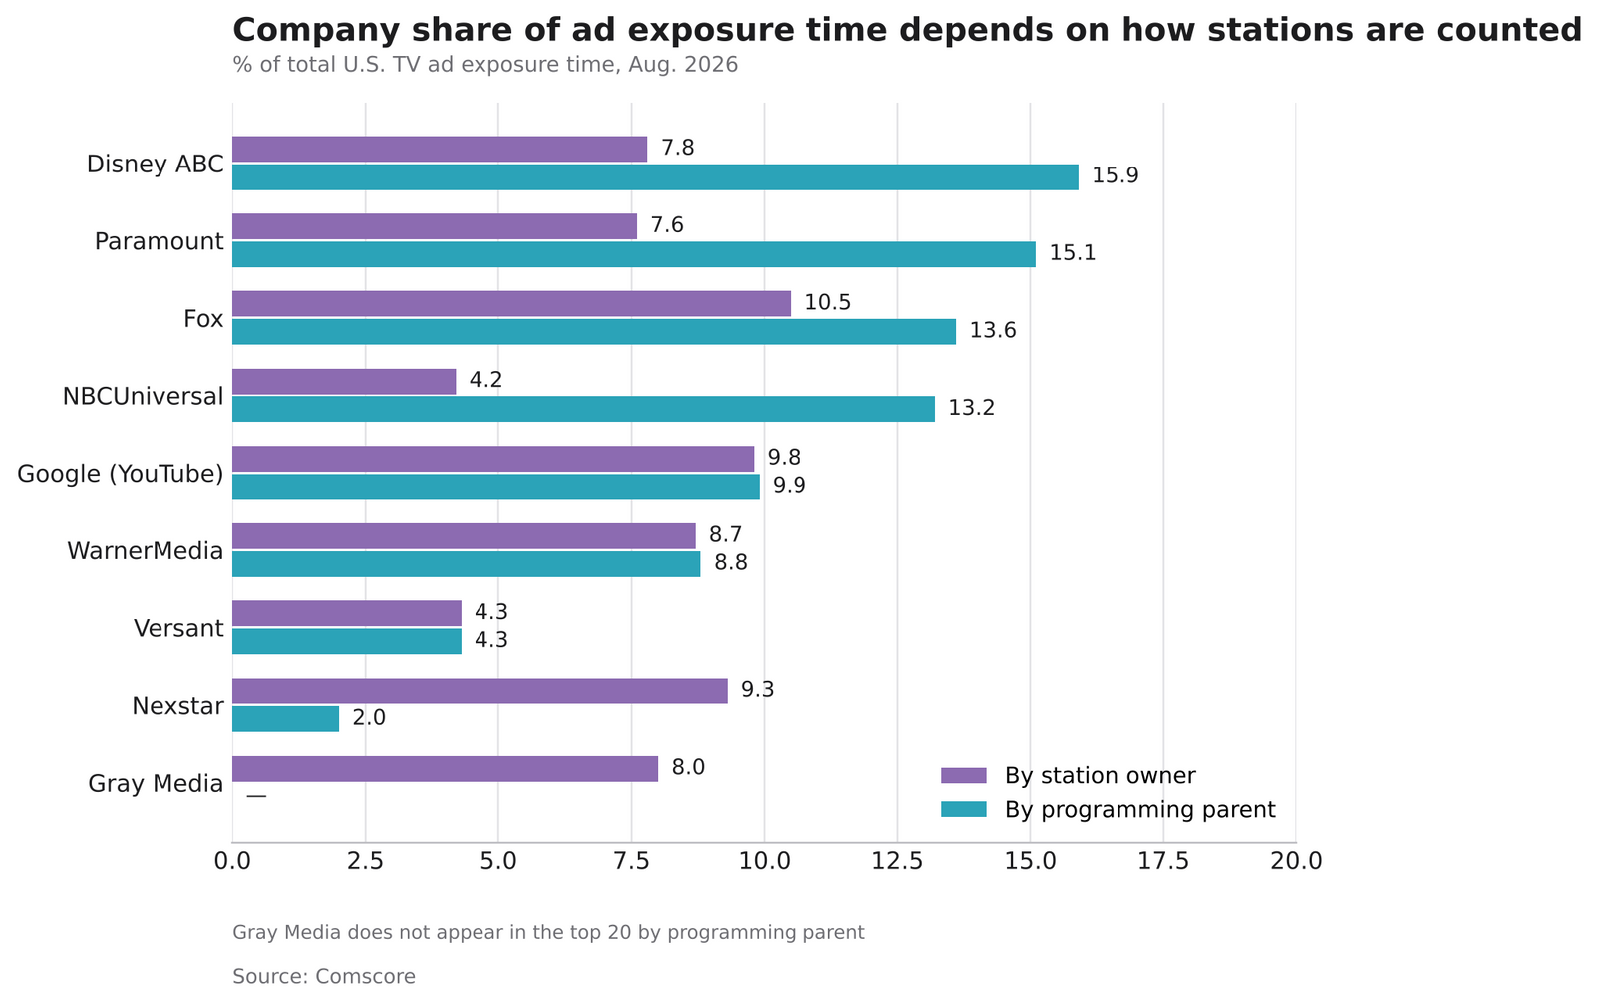
The owner view credits local stations to their operator; the programming view credits them to the network they carry. Source: Comscore
Company rankings shift sharply depending on who is credited with local stations. By station owner, Fox leads at 10.5%, followed by Google (9.8%), Nexstar (9.3%), WarnerMedia (8.7%) and Gray Media (8.0%). By programming parent, Disney ABC leads at 15.9%, ahead of Paramount (15.1%), Fox (13.6%), NBCUniversal (13.2%), Google (9.9%) and WarnerMedia (8.8%); Nexstar falls to 2.0% and Gray drops out of the top 20. Prime Video (1.6%), The Roku Channel (1.5%) and Netflix (1.4%) appear on both lists.
That is why station groups are betting on Comscore. In April, more than 15 broadcasters including Sinclair, Scripps and Cox Media Group signed on to its local measurement. “Nexstar welcomes greater transparency into how advertising reaches audiences across broadcast TV, cable, and streaming,” said Dan Lanzano, Nexstar’s president of national ad sales, in Comscore’s release. The release also lands in a contest for measurement leadership. Comscore’s second-quarter revenue fell 11.3% to $79.2 million (about 104.9 billion won), PPC Land reported. Nielsen, for its part, drew criticism from the Video Advertising Bureau after delaying its February Gauge; the two companies’ August reports came out a day apart.
New York 5.6%, Los Angeles 4.2%: ad time broken down across 210 markets
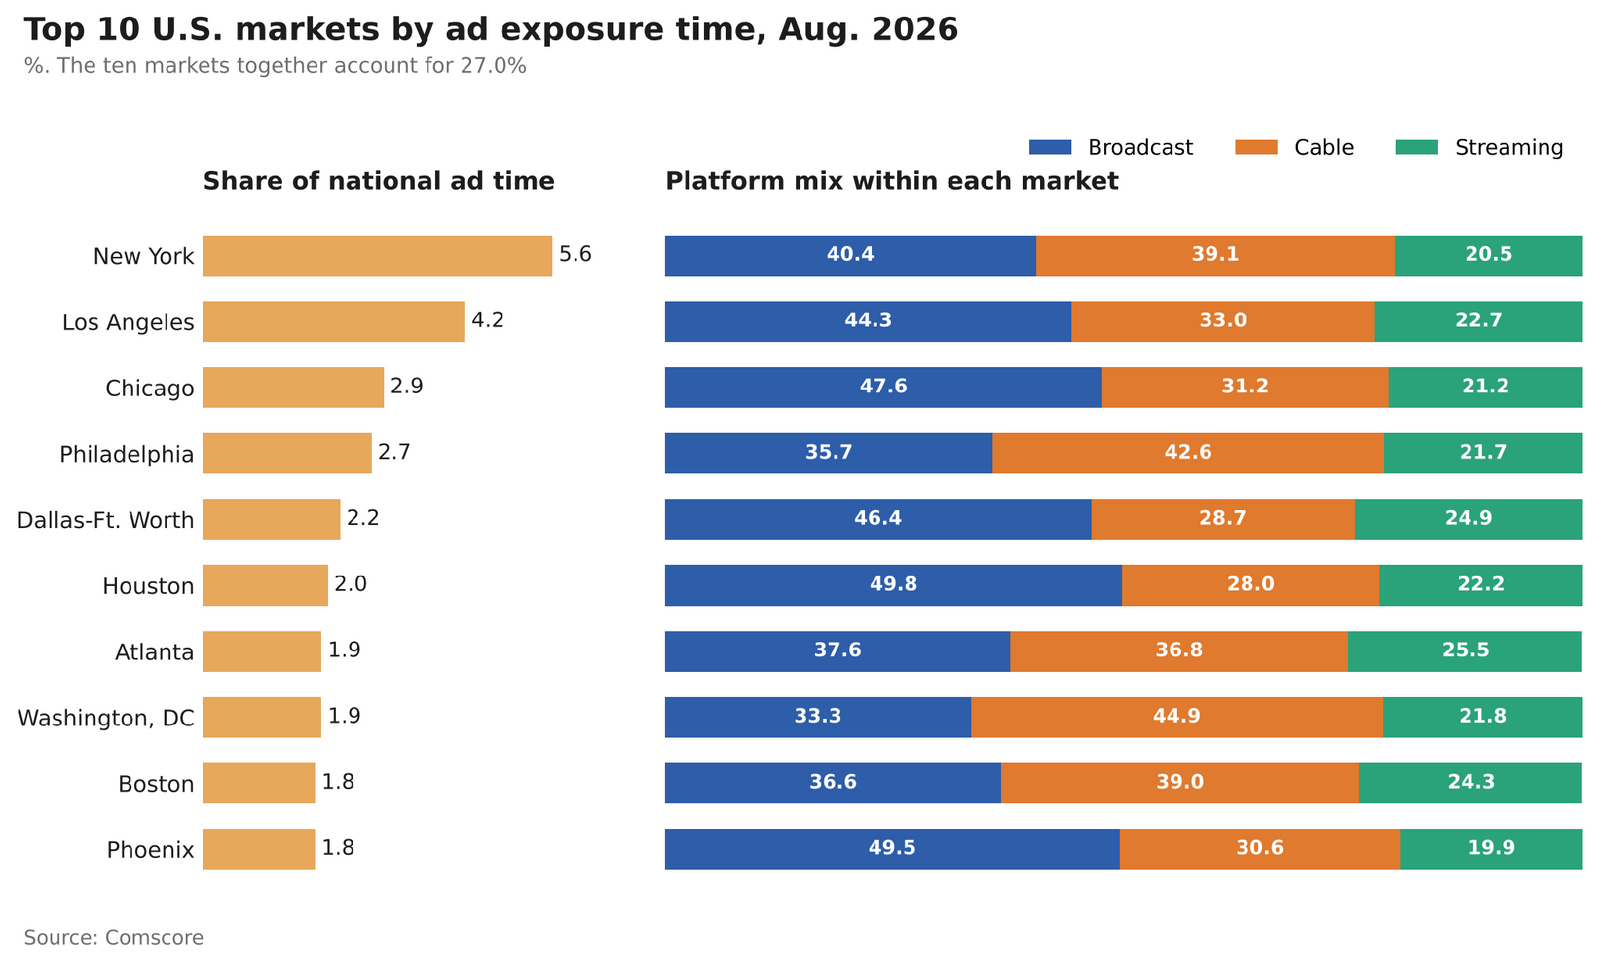
The ten largest markets by ad exposure time and their platform mix. Cable outweighs broadcast in Washington, Philadelphia and Boston. Source: Comscore
Comscore breaks ad time down to the local market. In August, New York took 5.6% of national ad exposure time, Los Angeles 4.2%, Chicago 2.9%, Philadelphia 2.7%, Dallas-Ft. Worth 2.2% and Houston 2.0%, with Atlanta and Washington at 1.9% and Boston and Phoenix at 1.8%. The ten together account for 27.0%.
The platform mix differed by market. Streaming’s share was highest in Atlanta (25.5%), Dallas-Ft. Worth (24.9%) and Boston (24.3%), and lowest in Phoenix (19.9%) and New York (20.5%). Broadcast was strongest in Houston (49.8%) and Phoenix (49.5%). Cable outweighed broadcast in Washington (44.9% vs. 33.3%), Philadelphia (42.6% vs. 35.7%) and Boston (39.0% vs. 36.6%).
U.S. station groups such as Sinclair and Scripps can now sell local inventory against market-level exposure figures. Korean regional broadcasters have no such evidence: there is no cross-platform exposure metric for local ad sales, and regional MBC affiliates and private regional stations are folded into the terrestrial total in Korea’s annual ad spending survey.
Korea: more ad time allowed, but no yardstick for minutes actually seen
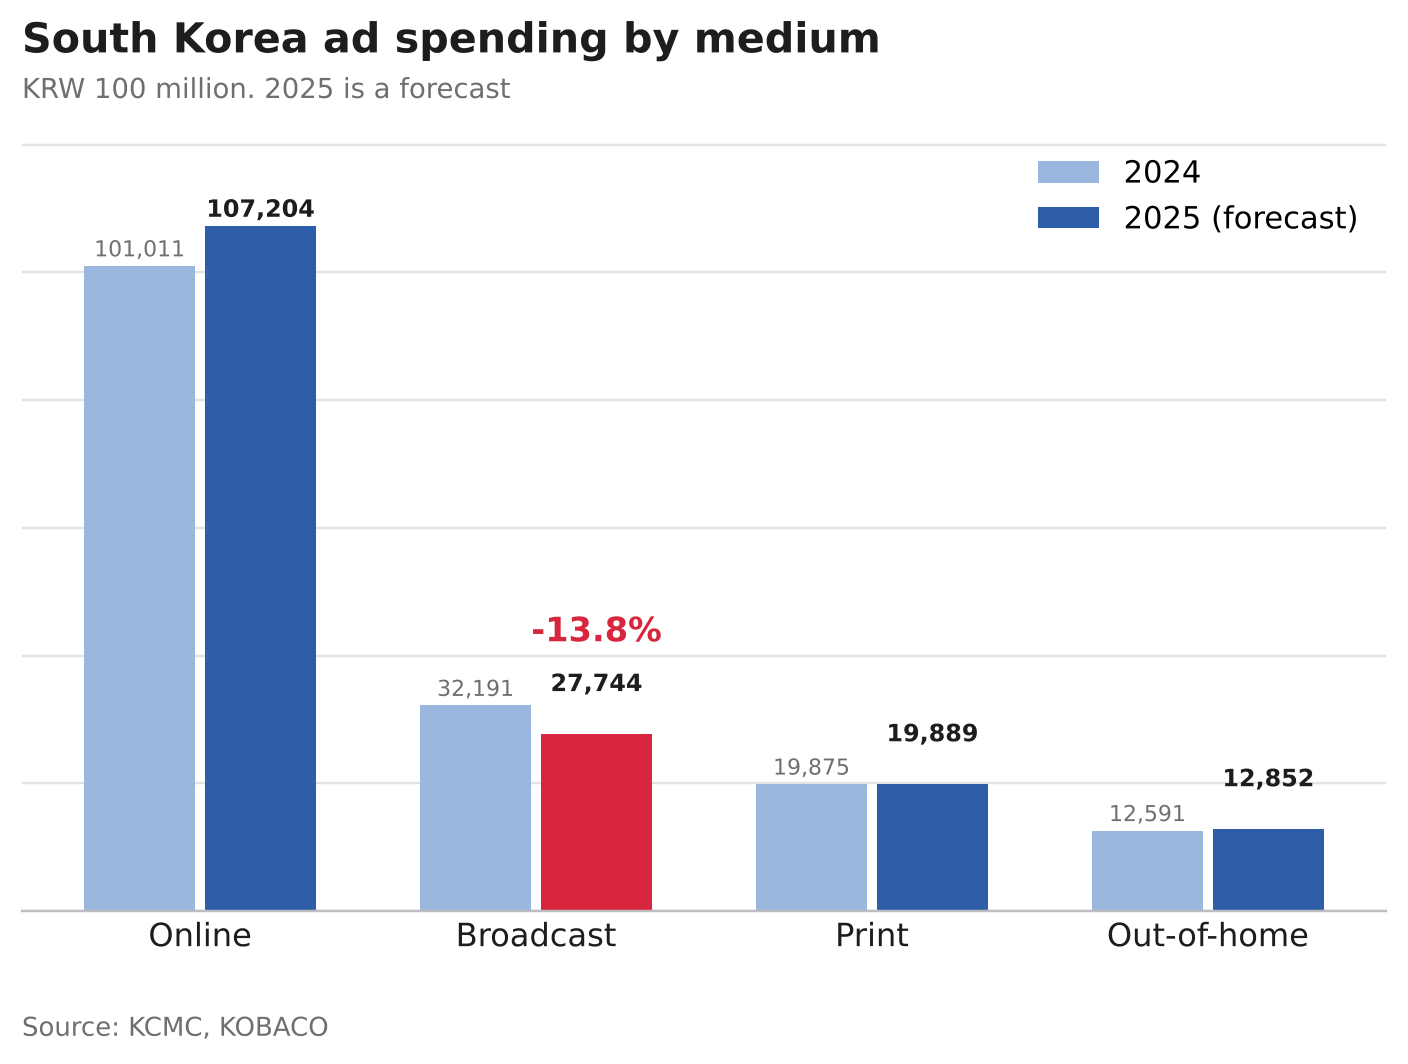
Broadcast ad spending fell an estimated 13.8% in 2025, below 3 trillion won for the first time. Source: KCMC, KOBACO
Korea’s broadcast ad market is under more pressure. The 2025 advertising spending survey by the KCMC and the Korea Broadcast Advertising Corp. (한국방송광고진흥공사, KOBACO) estimated total spending at 17.27 trillion won ($13.04 billion) in 2025. Online rose from 10.10 trillion won in 2024 to an estimated 10.72 trillion won ($8.09 billion); broadcast fell from 3.22 trillion won to 2.77 trillion won. Terrestrial broadcasters (TV, radio and DMB) fell from 1.23 trillion won to an estimated 1.05 trillion won ($792 million).
Online took 62.1% of the 2025 total and broadcast 16.1%. In the U.S., broadcast and cable still hold 77.7% of ad minutes. Spending and exposure time are different yardsticks — and that is the problem: Korea has no regularly published metric comparing how long ads are actually seen across TV and streaming, so broadcasters have no time-based figure for the attention they still command.
Regulators opened the door to more ad time first. The KCMC approved the amended decree on Aug. 12 and it took effect on Oct. 16. Per-program limits are gone; channels may run ads for up to 20% of daily airtime, up from 17%, with a separate 20% cap in prime time (7–11 p.m. weekdays, 6–11 p.m. weekends and holidays). Mid-rolls are allowed in programs of 30 minutes or more; 45-to-60-minute programs may carry two breaks instead of one, 60-to-90-minute programs three instead of two. The regulator estimated about 50 billion won ($37.7 million) in added revenue from the mid-roll change.
The rationale is regulatory asymmetry: YouTube and Netflix are classified as value-added telecom services and fall outside broadcast ad rules, Kyunghyang Shinmun (경향신문) reported on July 31. While U.S. paid streamers raised hourly ad loads 18%, Korean broadcasters gained regulatory room to add ad time of their own. But more minutes do not by themselves raise prices. Whether the new mid-roll minutes are watched without viewers tuning out will set what they sell for.
Advertiser budgets are already moving to streaming. In the KCMC–KOBACO first survey of 153 advertisers, 84 planned to buy streaming ads in 2026, raising budgets 7.6% on average; 65.5% preferred Netflix and 6.0% TVING, and the 27.4% that chose “other” all named YouTube. Cost efficiency scored lowest on post-campaign satisfaction (63.4 points).
Some 59.7% of Korean streaming users are on ad tiers, according to KT Nasmedia’s (KT나스미디어) 2026 survey, CEO Score Daily reported. Korean streamers are selling attention rather than volume. Lee Chun (이춘), ad director at Netflix Korea, told advertisers on July 7 that the market was shifting from how many saw an ad to who paid closer attention, MTN reported. TVING’s first-quarter ad revenue rose 35% on the World Baseball Classic, The Financial News reported.
K-FAST: on 600 million smart TVs, the product is ad minutes, not channel counts
Abroad, FAST has emerged as a new revenue route. On June 4 the KCMC held a roundtable on global FAST competitiveness at Samsung Electronics’ Innovation Museum in Suwon, with Samsung, LG, CJ ENM, KBS, MBC, SBS and AI companies Hudson AI and ESTsoft among about 25 attendees, Newstomato (뉴스토마토) reported. They discussed data-driven programming, ad strategies and investment in content made for FAST. “Korea has both a smart TV infrastructure of 600 million units distributed worldwide through Korean electronics makers and world-class broadcast content production capability,” said KCMC chairman Kim Jong-cheol (김종철). Newstomato wrote that the global FAST market is forecast to grow from 18 trillion won in 2025 to 47 trillion won (about $35.5 billion) in 2030.
The Ministry of Science and ICT and KAIT launched the Global K-FAST Alliance in April 2025; it had 68 members by the end of 2025. The ministry allocated 8 billion won ($6.04 million) to an AI-dubbing K-FAST program, Money Today (머니투데이) reported on May 30. Samsung TV Plus passed 100 million monthly active users in 30 countries in February, with about 4,300 channels and 66,000 on-demand titles, Samsung said. In a Parks Associates survey, 46% of U.S. internet households used FAST for long-form video; Samsung TV Plus ranked fourth and LG Channels sixth.
Results have yet to match the ambition. At the June roundtable, participants noted that viewing of Korean content on FAST platforms had fallen short of expectations, Newstomato reported. At home, an industry source told Money Today that FAST “is closer to pay TV than to streaming services, and pay TV in Korea is very reasonably priced.” Korean streaming services are moving into free, ad-supported tiers instead: Coupang Play (쿠팡플레이) launched one for Coupang members in June 2025, and TVING (티빙) added ad-supported service to the scope of its free offering in May, Herald Business (헤럴드경제) reported.
Measured against Comscore’s figures, Korean broadcasters’ FAST channels in the U.S. are competing for the 21.1% of streaming ad time held by Tubi, The Roku Channel and Pluto TV, a market that sells ad minutes rather than channel counts. That Samsung TV Plus passed 100 million users yet missed the top 10 suggests that distribution scale does not translate directly into ad-time share. On the other hand, news drew a larger share of ads than of viewing in Amagi’s data, and Fox News led U.S. cable in ad time — an opening for Korean broadcasters with news and live programming.
Outlook: minutes seen are the ad market’s currency — Korean broadcasters need measurement first
Comscore’s first report carries three messages. First, viewing time and ad time are not the same: streaming took half of U.S. TV viewing but just over a fifth of ad time, while broadcast held 43.2% of ad time on 17.5% of viewing. Second, within streaming, ad time sits mostly with free services such as YouTube and FAST. Third, paid services are catching up by raising ad loads, while Tubi and Roku are growing revenue by double digits. Heading into the 2027 upfronts, U.S. broadcasters have an ad-time number to cite and streaming services a viewing-time number. Nielsen will publish currency-aligned September and October Gauges together later this year, with back data to ease the transition.
The metric has its own work to do. Comscore will publish monthly, but it has not yet disclosed absolute ad minutes, rankings of individual FAST channels, or how ad time on channels inside FAST platforms — including those supplied by Korean broadcasters — is credited. How much methodology it discloses will decide whether buyers treat the report as a second reference point alongside the Gauge.
The implications for Korean broadcasters are clear. At home, the question is how much of the estimated 182.4 billion won ($137.7 million) drop in terrestrial ad revenue in 2025 the new ad minutes recover. The rules now allow more ads, but without evidence that those ads were seen, broadcasters will struggle to change the cost-efficiency concerns advertisers rated lowest. That is why Korea needs an exposure metric that measures TV, streaming and FAST in the same unit. Such a metric would first show whether, as in the U.S., the ranking by ad time differs from the ranking by viewing, and how much regional broadcasters could sell market by market.
Abroad, the question is how much of FAST’s 21.1% of U.S. streaming ad time K-FAST channels can win. Government K-FAST funding currently goes to AI dubbing, while practitioners in Amagi’s survey ranked per-platform metadata reformatting as their biggest operational drag (86%). Support should extend beyond translating content into local languages to the operational and measurement capabilities that get channels surfaced on platforms and prove how many ad minutes were seen. The broadcasters that can prove how many minutes their ads were seen — not how many channels they launched — will set the next price, at home and abroad.
Exchange rate: $1 = 1,324.6 won (Seoul close, Oct. 23, 2026, per Seoul Finance).
Quotations in double quotation marks are as reported; unquoted passages summarize reporting. Statements from Comscore’s release are quoted via PPC Land. Methodology details follow the Score Report FAQ.
The 65.5% (free) and 32.0% (paid ad tiers) groupings, total-TV shares, and ad-per-viewing ratios are K-EnterTech Hub calculations from Comscore’s and Nielsen’s published figures. Both reports cover August 2026 but differ in unit (household ad exposure vs. persons 2+ viewing) and in how services are grouped; service-level comparisons are directional.
Sources
1. Comscore, The Score Report (August 2026) and FAQ — https://core.comscore.com/articles/The-Score-Report/
2. Nielsen, August 2026 Gauge release, Oct. 22, 2026 — https://www.nielsen.com/news-center/2026/tv-viewing-cools-off-in-nielsens-august-gauge-reports-as-sports-take-a-breather-and-school-resumes/
3. Digiday, “Future of TV Briefing: YouTube, Tubi top streamers’ share of ad exposure time,” Tim Peterson, Oct. 21, 2026 — https://digiday.com/future-of-tv/future-of-tv-briefing-youtube-tubi-top-streamers-share-of-ad-exposure-time/
4. PPC Land, “Streaming gains 6.2 points of US TV ad exposure in a year, Comscore finds,” Oct. 21, 2026 — https://ppc.land/streaming-gains-6-2-points-of-us-tv-ad-exposure-in-a-year-comscore-finds/
5. StreamTV Insider, “CTV share of ad exposure time rises but sees gap with viewership” — https://www.streamtvinsider.com/advertising/ctv-share-ad-exposure-time-rises-sees-gap-viewership
6. Comscore, 2025 State of Streaming release, Oct. 29, 2025 — https://comscore.com/Insights/Press-Releases/2025/10/Comscores-2025-State-of-Streaming-Report
7. Amagi, June 2026 AIRTIME Report, July 1, 2026 — https://www.amagi.com/newsroom/amagi-releases-june-2026-airtime-report-fast-viewing-hours-grow-55-yoy-as-metadata-friction-escalates
8. TheWrap, Fox fiscal Q4 2026 earnings (Tubi) — https://www.thewrap.com/media-platforms/tv/fox-corporation-earnings-q4-2026/
9. eMarketer, Roku Q2 2026 — https://www.emarketer.com/content/roku-s-record-quarter-reinforces-its-strength-competitive-ctv-market
10. eMarketer, “Streaming ad loads jump 18%,” Sept. 8, 2026 — https://www.emarketer.com/content/streaming-ad-loads-jump-18--raising-creative-bar
11. MediaPost, “Streamers Add Ad Minutes: Do Viewers Mind?,” Oct. 14, 2026 — https://www.mediapost.com/publications/article/418721/streamers-add-ad-minutes-do-viewers-mind.html
12. Samsung Newsroom, Samsung TV Plus reaches 100 million users, Feb. 13, 2026 — https://news.samsung.com/global/from-hardware-roots-to-global-media-platform-how-samsung-tv-plus-reached-100-million-users
13. PPC Land, Nielsen February Gauge delay and VAB criticism — https://ppc.land/nielsens-gauge-delay-sparks-market-integrity-row-as-tv-data-suppression-claims-mount/
14. PPC Land, Comscore Q2 2026 results — https://ppc.land/comscore-cuts-up-to-25-million-in-annual-costs-as-q2-revenue-falls-11-3/
15. PPC Land, broadcasters sign Comscore local measurement, Apr. 21, 2026 — https://ppc.land/why-sinclair-and-14-other-broadcasters-just-bet-on-comscore-for-local-tv/
16. Newstomato (뉴스토마토), KCMC K-FAST roundtable, June 4, 2026 — https://newstomato.com/ReadNews.aspx?no=1303032
17. Money Today (머니투데이), Samsung TV Plus and K-FAST Alliance, May 30, 2026 — https://www.mt.co.kr/article/2026052916312037462
18. Herald Business (헤럴드경제), TVING ad-supported free service, May 20, 2026 — https://www.heraldk.com/article/2026052018363765304
19. Journalists Association of Korea (기자협회보), 2025 ad spending survey, Jan. 8, 2026 — https://www.journalist.or.kr/news/article.html?no=60072
20. Journalists Association of Korea, KCMC–KOBACO streaming ad survey, Jan. 8, 2026 — https://www.journalist.or.kr/news/article.html?no=60073
21. Herald Business, ad spending shares, Jan. 7, 2026 — https://www.heraldk.com/article/2026010718000003024
22. Digital Daily (디지털데일리), ad deregulation plan, June 12, 2026 — https://www.ddaily.co.kr/page/view/2026061214474293760
23. Kyunghyang Shinmun (경향신문), July 31, 2026 — https://khan.co.kr/article/202607311442001
24. Journalists Association of Korea, decree approved, Aug. 12, 2026 — https://www.journalist.or.kr/news/article.html?no=61481
25. SBS Biz, decree in force from Oct. 16, Sept. 30, 2026 — https://biz.sbs.co.kr/amp/article/20000337613
26. MTN, Netflix Behind The Streams 2026, July 9, 2026 — https://news.mtn.co.kr/news-detail/2026070910592497507
27. The Financial News (파이낸셜뉴스), July 21, 2026 — https://www.fnnews.com/news/202607211807231408
28. CEO Score Daily (CEO스코어데일리), Mar. 30, 2026 — https://www.ceoscoredaily.com/page/view/2026033016484198828