
Streaming's Next Growth Story: Going Back to TV

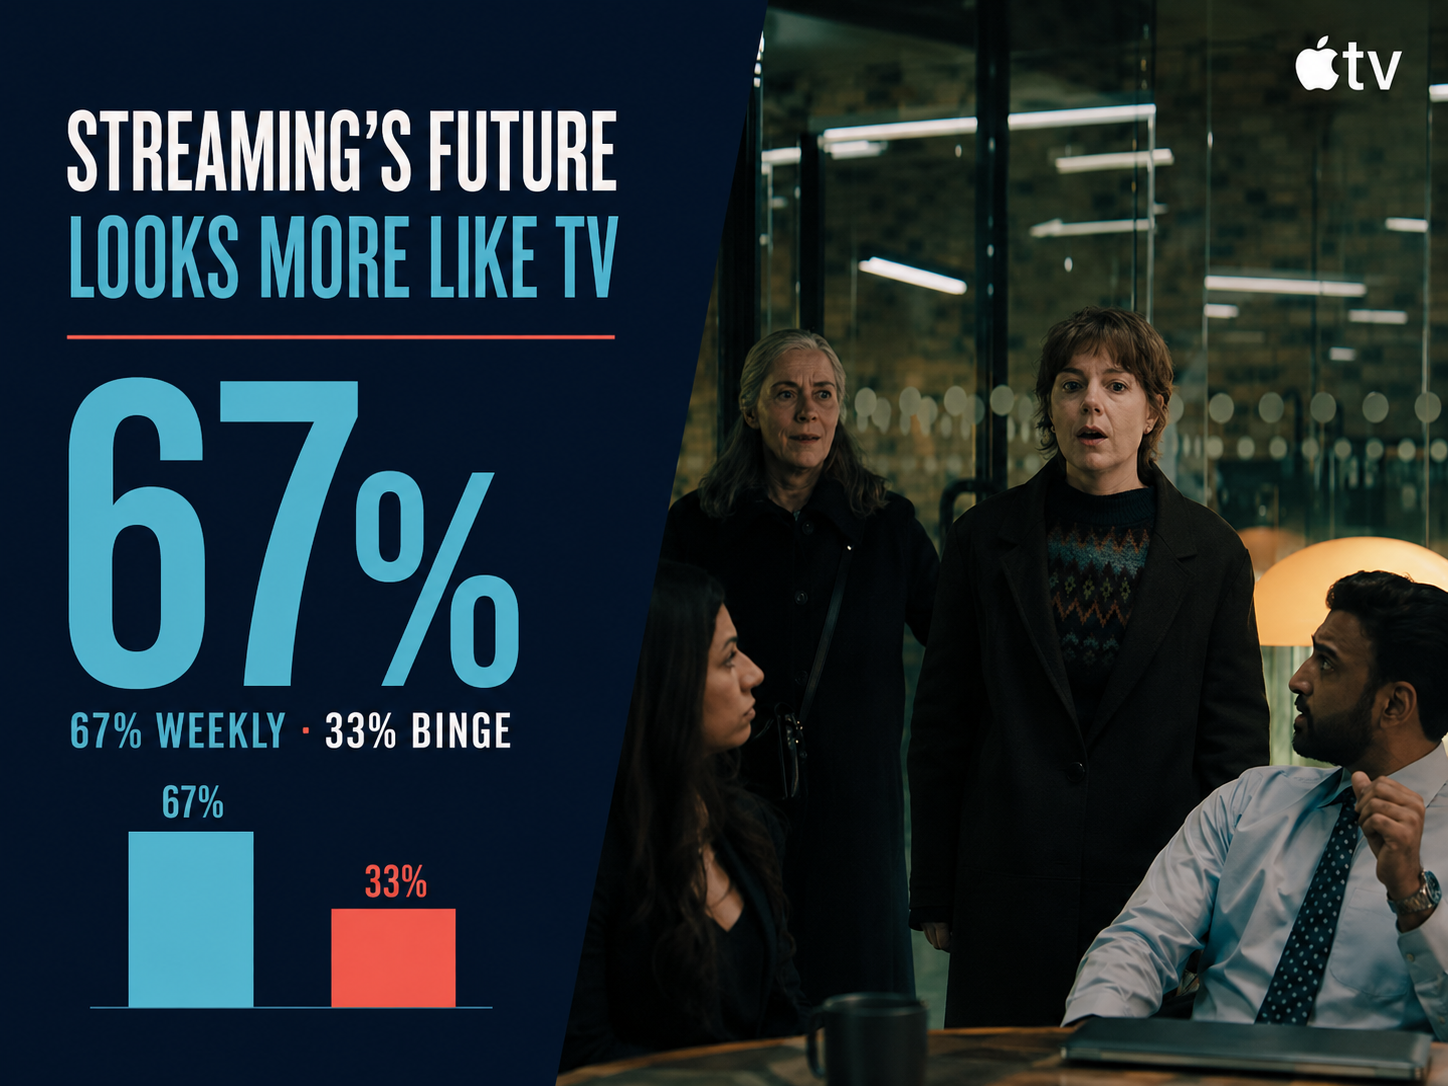
Apple TV’s biggest launch ever came from a weekly release. Weekly titles accounted for 67% of the top 100 U.S. digital originals in 2025, more than double the 33% share of binge drops, and last Christmas Netflix followed back-to-back NFL games

Streaming's Next Growth Story: Going Back to TV

Ted Lasso S4 draws 296.6 million minutes in two days; weekly releases take 67% of the top 100, and Christmas Day set a 55.1-billion-minute record

Apple TV is releasing “Ted Lasso” season four one episode a week on Wednesdays. The run began Aug. 5 and closes with the tenth episode on Oct. 7. There are no double-episode weeks.

Photo: Apple TV, “Slow Horses” trailer

That schedule produced Apple TV’s largest audience to date. Nielsen measured 296.6 million U.S. viewing minutes for the season four premiere across Aug. 4–5. On Aug. 5 alone the episode passed 200 million minutes and ranked as the most-streamed program in the United States.

The previous Apple TV record was held by season three of the same series in 2023 at 215.1 million minutes; the premieres of “Severance” and “Pluribus” sit below it. Divided by the 42-minute runtime, that translates to an estimated 7.1 million views.

Reaching that figure without posting a full season compresses the current scheduling calculation in U.S. streaming. Among the top 100 U.S. digital originals tracked by Parrot Analytics, weekly releases made up 67% of titles in 2025 and binge drops 33%. In 2017 the split ran the other way, 81% binge to 19% weekly.

Slowing growth sits behind it. Antenna estimates that U.S. Premium SVOD subscribers grew 7% in 2025, down from 12% in 2024, with category growth falling into single digits for the first time. As acquisition slows, the remaining levers are churn suppression and advertising exposure, and both improve when viewing is spread across weeks.

Weekly 67% vs. binge 33%… the gap has doubled since the 2021 crossover

Share of binge and weekly releases among the top 100 U.S. digital originals, 2017–2025. Source: Parrot Analytics

There were two turning points, in 2019 and 2021. Parrot Analytics found that in 2019 the supply share of weekly titles was unchanged at 22%, but their share of audience demand exceeded their share of supply for the first time. Apple TV+ and Disney+ both launched at the end of that year and released most of their originals episodically. In 2021 supply itself flipped, with weekly titles outnumbering binge titles in the top 100, and the gap has widened every year since.

The 2025 split is 67 to 33 — the first year in which weekly titles in the top 100 numbered more than twice their binge counterparts. Measured against the 69% to 81% share binge drops held from 2017 through 2020, 48 percentage points have moved in eight years.

Apple TV is both the origin of that shift and its most consistent practitioner. It has released most of its originals weekly since launching in November 2019, and it carries the smallest subscriber base among the services that appear in Nielsen’s streaming top 10. Season three of “Ted Lasso” still finished 2023 as the most-watched streaming original of the year, with 16.9 billion minutes across 24 episodes.

Ted Lasso runs ten weeks from Aug. 5… Apple TV’s second-half schedule

Apple TV’s second-half lineup is entirely weekly. “Slow Horses” season six follows “Ted Lasso,” running six weeks from Sept. 16 to Oct. 21, and the German-language original “Where’s Wanda?” season two runs eight weeks from Oct. 21 to Dec. 9. Strung together, the three titles put a new episode on the service every week from early August to early December.

Episode counts were adjusted as well. “Ted Lasso” dropped from 12 episodes in seasons two and three to 10 in season four — fewer episodes at a strict one-week interval rather than more episodes to stretch the run. Apple TV also opens episodes of its flagship titles at 9 p.m. ET the night before the official release date.

Other services have placed their fall titles weekly or in hybrid form. HBO Max has scheduled “Ware” and “4 Blocks Zero” weekly, and Hulu and FX apply a hybrid pattern to “American Horror Story” season 13, front-loading several episodes and distributing the remainder weekly — the same design used for “The Shards.”

Platform

Title

Window

Pattern

Apple TV

Ted Lasso S4

Aug. 5 – Oct. 7

Weekly (10 eps)

Apple TV

Slow Horses S6

Sept. 16 – Oct. 21

Weekly (6 eps)

Apple TV

Where’s Wanda? S2

Oct. 21 – Dec. 9

Weekly (8 eps)

HBO Max

Ware / 4 Blocks Zero

Fall

Weekly

Hulu · FX

American Horror Story S13

Fall

Hybrid

Netflix

The Gentlemen S2

Sept. 3

All at once (8 eps)

Netflix

East of Eden

Oct. 1

All at once

Netflix

A Different World

Second half

All at once (10 eps)

Release patterns for major U.S. streaming titles, second half of 2026. Sources: Apple TV, Deadline, Netflix Tudum, Axios Media Trends

55.1 billion minutes on Christmas Day… Netflix builds a schedule event

Why weekly release came back showed up in a single day last December. Nielsen measured 55.1 billion U.S. streaming minutes on Dec. 25, breaking the previous single-day record — 51.2 billion on Dec. 25, 2024 — by 8%. It was only the second time daily streaming volume passed 50 billion minutes. For December 2025 as a whole, streaming took 47.5% of TV viewing, the largest share Nielsen’s The Gauge had reported to that point.

The day was built the way broadcasters have built holidays for decades. Netflix carried back-to-back NFL games and followed them with new episodes of “Stranger Things,” and Prime Video picked up a later NFL game. Live sport gathers the audience; a major series takes the handoff.

“Stranger Things” season five was split three ways: episodes 1–4 on Nov. 26, the day before Thanksgiving; episodes 5–7 on Christmas; and the 125-minute finale on Dec. 31, which played simultaneously in more than 350 theaters across the U.S. and Canada. In Nielsen’s January 2026 report the series was the most-streamed program with 15.4 billion minutes. Season four had run in two parts; season five ran in three. Netflix has applied the same treatment to “Bridgerton,” “Wednesday” and “Emily in Paris.”

Streaming becoming television itself is the other face of the same shift. In Nielsen’s May 2026 Gauge, streaming took 48.6% of TV viewing against a combined 39.6% for broadcast (19.2%) and cable (20.4%). YouTube led all distributors at 13.8% and Netflix held 8.0%. A medium that now takes half of all viewing reaching back for the schedule and the season follows from that position.

Netflix splits its biggest titles… but the fall lineup drops whole

Netflix is nonetheless posting its major fall titles all at once. All eight episodes of Guy Ritchie’s “The Gentlemen” season two arrive Sept. 3, and “East of Eden,” the John Steinbeck adaptation starring Florence Pugh, arrives Oct. 1. A sequel to the NBC sitcom “A Different World” is prepared as ten half-hour episodes.

Split releases are reserved for the very top of the slate. The Korean original “When Life Gives You Tangerines” (폭싹 속았수다) delivered its 16 episodes four at a time over four weeks, while “Squid Game” and “Virgin River” dropped whole. Netflix chief content officer Bela Bajaria has not publicly explained the split-volume approach. Release pattern is being run as a title-by-title decision rather than a company-wide switch.

The “A Different World” sequel is a second kind of return, independent of release pattern. Jasmine Guy, Kadeem Hardison, Cree Summer and Darryl M. Bell reprise their roles and original director Debbie Allen serves as executive producer. Library-anchored projects that carry over an existing audience are multiplying at the same moment scheduling itself is reverting.

Binge demand share 35% against 33% of supply… first reversal since 2018

Binge releases: share of supply versus share of demand, 2025. Source: Parrot Analytics, via TheWrap

Supply tilting weekly and demand following are separate questions. In an analysis by Parrot Analytics insights manager Christofer Hamilton published by TheWrap on June 19, weekly titles took a larger share of demand than of supply every year from 2019 through 2024. In 2025 that inverted: a third of the top 100 were binge releases, and they accounted for 35% of total demand — the first time since 2018 that binge demand share exceeded binge supply share.

Hamilton compared demand curves by pattern. A pure binge drop such as “Squid Game” produces the largest peak immediately after release and decays from it just as quickly. Splitting a season, as “Bridgerton” did, produces a second lift at the second drop and lengthens the conversation. The weekly rollout of “House of the Dragon” and the hybrid pattern of “The Boys” hold demand at a steadier level for roughly two months.

Past the 60-day mark the three patterns converge at similar levels. Weekly scheduling protects against early cancellation and sustains buzz, but it does not by itself generate more long-tail demand. The choice narrows to where a title wants its largest burst of attention to fall.

Premium SVOD churn 4.6%… Q4 delivers 57% of annual net adds

The payoff shows up in subscription metrics. Antenna estimates the weighted average monthly churn rate for U.S. Premium SVOD settled at 4.6% in 2025, with churn flat or lower year over year in seven of the eleven months from September 2024 through August 2025 — against only two such months in the preceding 21. Seven of nine services showed more stable churn patterns than in 2023.

Sign-ups also concentrate. Antenna reports that Premium SVOD drove 31% of annual gross additions and 57% of net additions in the fourth quarter of 2025, as Black Friday pricing and major titles converge; Antenna describes Q4 as streaming’s equivalent of the broadcast fall season. Seasons and fall scheduling, in other words, have moved into the subscription calendar. As of June 2026, Premium SVOD churn stood at 4% and Specialty SVOD at 7%.

49 million subscriptions through Amazon Channels… the bundle returns too

Scheduling is not the only thing coming back. The New York Times reported on Aug. 24 that competition has moved from acquiring subscribers to owning the gateway. Amazon has sold at least 49 million subscriptions to outside services through Prime Video. YouTube signed a five-year agreement to carry Peacock’s series, sports and news inside its $16-a-month Premium tier, and also sells HBO Max and Paramount+. New subscriptions through Roku’s channels business rose 19% year over year in the second quarter.

Antenna estimates that subscriptions purchased through third-party platforms such as Amazon, Roku and YouTube have grown roughly 60% over three years and now account for about a third of new sign-ups. Antenna chief executive Jonathan Carson told the Times that what matters is which app a viewer opens when the television goes on and where the next few hours go.

Weekly scheduling and re-bundling aim at the same target: not the completion rate of an individual title, but how long a subscriber stays and when they leave. Channels, schedules and bundles — the three devices streaming dismantled — are returning in altered form.

Specialty SVOD reaches 42 million subscriptions on 14% growth… double Premium

Antenna’s “State of Subscriptions: Specialty SVOD Landscape 2026” shows which operators the gateway shift actually paid. Across the 31 Specialty SVOD services Antenna tracks, U.S. subscriptions reached 42 million in Q2’26, up 14% year over year. Premium SVOD grew 6% over the same period, and the two segments combined grew 7%, down from 12% a year earlier.

Premium and Specialty SVOD subscription growth. Source: Antenna

Specialty’s share of total subscriptions rose to 13% from 12% two years earlier. Net additions were positive in nine of the last ten quarters, the sole exception being Q1’26 at -300,000. Q2’26 delivered 1.8 million net adds on 11.2 million gross adds. Cancels rose from 6.6 million in Q1’24 to 9.4 million in Q2’26, so gross adds and cancels are scaling together, as they are in Premium.

Churn and survival separate the two segments. Specialty churn peaked at 9% in January 2026 and eased to 7% by June, against 4% for Premium in the same month. Specialty churn exceeded Premium every month, with the gap running 2 to 4 points. Antenna attributes the recurring January peak to subscribers rolling off Black Friday promotional offers.

Metric

Premium SVOD (10 services)

Specialty SVOD (31 services)

Subscription growth, Q2’26

6%

14%

Monthly churn, June 2026

4%

7%

Survival at month 1

77%

72%

Survival at month 3

54%

Survival at month 12

35%

27%

Premium and Specialty SVOD subscription metrics compared. Premium month-1 survival derived from the stated 5-point gap. Source: Antenna

Specialty survival falls to 72% one month after signing up and 54% after three. Fewer than half remain at month four, and 27% remain after a year, against 35% for Premium; the gap widens from 5 points at month one to 8 points at month twelve. Losses are steepest across the first three months.

63.6 million have tried a Specialty service… 61% use only one

The user base keeps widening. Antenna measured 156.0 million U.S. SVOD users in Q2’24 and 180.6 million in Q2’26, up 16%. Over the same span the number who had transacted with a Specialty service grew 55%, from 41.0 million (26%) to 63.6 million (35%). Across the past ten quarters an average of 2.8 million consumers paid for a Specialty service for the first time each quarter, 28.0 million in total.

Spending stays with one service, though. Of the 63.6 million Specialty users, 61% — 38.2 million — have subscribed to only one Specialty service. Two services account for 20% (12.7 million), three for 9% (5.4 million) and four or more for 10% (6.0 million). Genre services are not yet cannibalizing one another so much as leaving users untouched, and Antenna reads that as room for both services and distributors to present Specialty options to a broader audience.

Amazon Channels bills 67% of Specialty gross adds… Roku Channel up 2.5x

Specialty SVOD share of gross adds by distributor, Q1’24–Q2’26. Source: Antenna

Specialty growth came through Channels environments rather than owned apps. Amazon Channels accounted for 67% of Specialty gross additions in Q2’26, up 6 points from 61% a year earlier. Quarterly Specialty gross adds through Amazon Channels averaged 4.8 million in 2024, 5.8 million in 2025 and 6.6 million through the first half of 2026. The iTunes share moved the other way over the same span, from 16% to 8%.

The fastest-growing route is The Roku Channel, where Specialty gross adds rose 2.5x from 566,000 in Q1’24 to 1.4 million in Q2’26 and share nearly doubled from 7% to 13%. Year-over-year growth peaked at 153% in Q3’25 before moderating to 59% in Q2’26.

Specialty gross adds on YouTube Primetime Channels rose 47% year over year in Q2’26, holding at 39% or better for six straight quarters. Howdy, MGM+ and AMC+ lead Specialty acquisition on Roku Channels; Crunchyroll, MGM+ and AMC+ lead on YouTube Primetime Channels.

45% of new sign-ups start with Specialty… Premium falls from 60% to 38%

Amazon Channels sign-ups by the first service selected. Source: Antenna

What users pick first at the gateway has changed too. Amazon Channels drew 13.5 million new-to-Amazon subscribers over the past 12 months, up from 12.2 million the year before. A Specialty service was the first one selected by 45% of them in Q2’26, the high across the measured period. Premium SVOD — Paramount+, HBO Max, Starz, Discovery+ and Apple TV — fell to 38% from 60% in Q1’24. Peacock and FOX One, which entered in Q3’25, together took 21% of sign-ups in Q4’25.

Attachment rates are nearly identical across the two. Among new-to-Amazon subscribers, 22% of those who started with Premium and 21% of those who started with Specialty added a second service within six months. In both cases the added service is usually another Premium title, and adding both a Premium and a Specialty service remains rare at 1% each. Users who enter through Specialty are largely picked up by Premium.

Howdy at 3.0 million cumulative sign-ups, Wonder Project 2.2 million

Two services launched in the past year lifted the Specialty segment. At the end of Q2’26 Howdy had 1.6 million subscribers and The Wonder Project 850,000. Cumulative sign-ups since launch stand at 3.0 million for Howdy and 2.2 million for Wonder Project, 5.2 million combined. Wonder Project drew 511,000 sign-ups in its first month and crossed one million by month three; Howdy added nearly 1.3 million between April and June 2026 to reach 3.0 million.


Howdy

The Wonder Project

Subscribers, end of Q2’26

1.6M

850K

Cumulative sign-ups to June 2026

3.0M

2.2M

Survival at month 1

75%

76%

Later survival

39% (month 10)

38% (month 8)

Share aged 55+

52%

44%

Share aged 18–24

7%

6%

Metrics for the two new Specialty entrants. Specialty benchmark survival is 31% at month 10; the general population is 39% aged 55+. Source: Antenna

Both outperform the segment on retention. One month after signing up, Howdy held 75% and Wonder Project 76%, ahead of the vertical by 3 and 4 points. Howdy stood at 39% by month 10, 8 points above the 31% benchmark, and Wonder Project at 38% by month 8, 2 points above.

Their audiences skew old. Subscribers aged 55 and over make up 52% of Howdy’s base, 13 points above the general population’s 39%, and 44% of Wonder Project’s. The 18–24 cohort is the smallest segment for both at 7% and 6%, below the general population’s 12%. Citing the traction of recent entrants such as FOX One and ESPN Unlimited alongside these two, Antenna reads consumers as still open to new streaming propositions.

Schedule, season, bundle, channel… four devices coming back

Streaming stripped broadcast’s devices out one at a time in its early years: a library available any time instead of a schedule, continuous release instead of a fall refresh, single-service subscriptions instead of channel bundles, a flat fee instead of advertising. What is returning now is those four, in altered form.

Broadcast device

What streaming replaced it with

The form it returns in

Weekly schedule

Full season posted at once

67% of the top 100 released weekly or hybrid

Fall refresh and seasons

Continuous release, no seasonality

Q4 delivers 57% of annual net adds

Channel bundle

Single-service subscriptions

A third of new subscriptions via third parties

Ad scheduling

Ad-free flat fee

Ad tiers, with episodes spread to create selling windows

Broadcast devices streaming dismantled, and their current form. Sources: Parrot Analytics, Antenna, Nielsen, The New York Times

None of them return unchanged. Weekly scheduling is built around a title rather than a channel; the seasonal refresh is made of promotional pricing and the placement of major releases rather than a programming grid; the bundle is run by Amazon, YouTube and Roku rather than a cable operator; and advertising is sold by user rather than by daypart. The devices are the same. Who holds them is not.

What this means for Korean operators

Korea starts from a different position. TVING (티빙) and Wavve (웨이브) have always supplied episodes weekly in step with broadcast schedules, and Coupang Play (쿠팡플레이) generates weekly return visits through live sports. What the U.S. market is reverting to is an asset Korean operators already hold. The full drop is the default on the Netflix Korea original side.

Netflix first applied a staggered release to a Korean original with “When Life Gives You Tangerines” (폭싹 속았수다), released from March 7, 2025 — 16 episodes delivered four at a time over four weeks. Bae Jong-byung (배종병), senior director for Netflix series, said at the Next on Netflix 2025 Korea event that the release pattern was chosen so viewers could enjoy the work in line with its creative intent. The title slipped to third in the global non-English chart in its fourth week and returned to first in its fifth.


United States

Korea

Default pattern

Weekly 67%, binge 33% (top 100)

Weekly supply tied to broadcast schedules

Nature of the shift

Reversion from binge to weekly

Weekly retained; staggered drops are exceptions

Reference case

Ted Lasso S4, ten weekly episodes

When Life Gives You Tangerines, four drops of four

Return-visit device

Weekly scheduling, split seasons, Q4 concentration

Live sports, simulcast supply

Bundled distribution

Subscriptions via Amazon, YouTube, Roku

Telecom and commerce bundles

Release and distribution structures compared. Sources: Parrot Analytics, Antenna, The New York Times, Korean operator disclosures and press reports

For operators running ad tiers, the release pattern becomes an inventory question. Sixteen episodes consumed in a day concentrate impressions into one week; the same episodes spread over four weeks create four selling windows. TVING turned an operating profit of 6 billion won on revenue of 140.7 billion won in the second quarter, driven by longer session times from live and sports programming and expanded advertising revenue. Episode placement connects directly to that structure.

More decisions move upstream into production. As “Ted Lasso” cut from 12 episodes to 10 while holding a strict weekly interval, episode count and release spacing are variables that have to be designed together. A four-week split needs a reason to return every four episodes, and a hybrid pattern shifts both early entry and the point of drop-off depending on how many episodes open the run. Because editing and episode boundaries are hard to revise afterward, the release pattern belongs among the planning-stage variables.

Scale is not the only route to viewing time. Apple TV has the smallest subscriber base among services that reach Nielsen’s streaming top 10, yet a single title took the No. 1 U.S. streaming position for the day. For Korean operators that cannot compete with Netflix on subscriber counts, designing release spacing and attention windows works independently of scale.

On distribution, the gateway is the variable. A third of new U.S. subscriptions now arrive through third-party platforms, and within Specialty SVOD a single one — Amazon Channels — bills 67% of gross additions. Korean services expanding abroad have more reason to weigh routes such as Amazon Channels or Roku channels alongside a standalone app launch. The comparison is between the cost of building awareness service by service and the commission paid to sit inside a gateway.

The Specialty numbers also spell out the terms for a standalone K-content service abroad. Individual services are small in a market where 31 of them share 42 million subscriptions, but the segment grows at more than double the Premium rate, and 35% of U.S. SVOD users have already paid for a Specialty service at least once. Crunchyroll leading Specialty acquisition on YouTube Primetime Channels shows that a service with a clear genre and cultural identity can hold a place inside a gateway. Howdy and Wonder Project accumulating 5.2 million sign-ups within a year is evidence that new entry still works.

The same data marks the weakness. More than half of Specialty subscribers are gone by month four and 27% remain after a year, 8 points below Premium. For a Korean operator entering abroad in Specialty form, retention is decided in the first three months after sign-up, and arranging the library and release spacing so that new episodes keep landing during that window is a problem to solve before the gateway commission. That is why the scheduling reversion and the gateway shift are not separate questions.

What this means for Korean broadcasters

Broadcasters commission outside production, hold the contracts with performers, and own the archives. The return of scheduled release reaches each of those positions differently.

As commissioning parties, they face the question of fixing episode boundaries and release windows at contract stage. Whether a production company sells to a streamer as a full drop or a staggered release changes the promotional period and the holdback calendar for reruns and VOD. It is also where a broadcaster’s existing weekly-scheduling capability can be priced into terms.

In performer contracts, longer exposure windows argue for revisiting how reuse compensation is calculated. The same 16 episodes released in a day and released over four weeks differ in run length, promotional obligations and the timing of secondary use. A ten-week weekly run of the kind “Ted Lasso” is on also asks ten weeks of promotional availability from its cast. If the existing per-episode framework was not written with staggered or hybrid releases in mind, settling it at the standard-clause level rather than contract by contract reduces disputes.

On the archive side, pairing library titles with new release cycles becomes workable. Netflix keeps all six original seasons of “A Different World” on the platform alongside the sequel. Korean broadcasters hold decades of series and variety libraries, which allows remake and sequel development to be planned together with library placement as a single scheduling decision.

Standing an archive up as a Specialty service is another option on the table. Antenna’s 31 tracked Specialty services include documentary, period and genre products that overlap with what a broadcaster’s library already holds, and Howdy’s base — 52% aged 55 and over — is not far from the audience of a Korean broadcast archive. What such a service needs, though, is not catalogue size but a schedule that keeps landing new episodes through the first three months.

FAST channels connect here as well. For an operator that still runs a schedule, the return to weekly release is not a new grammar to learn but an asset already in operation.

The open question is the order in which that asset is placed across Streaming, FAST, Specialty SVOD and overseas distribution.

Sources

· Variety (Aug. 13, 2026), “Ted Lasso Season 4 Opens With 296.6 Million Minutes Watched in Two Days, Apple TV’s Biggest Launch Ever” — https://variety.com/2026/tv/news/ted-lasso-season-4-ratings-apple-tv-1236834053/

· Deadline (Aug. 2026), “Ted Lasso Season 4 Enters The Pitch With Apple TV’s Biggest Premiere Ever” — https://deadline.com/2026/08/ted-lasso-season-4-premiere-us-viewership-nielsen-apple-tv-1237033025/

· Deadline, “Ted Lasso Season 4 Release Schedule: Episode Rollout On Apple TV” — https://deadline.com/2026/08/ted-lasso-season-4-release-schedule-new-episodes-apple-tv-1237015072/

· The Hollywood Reporter (Aug. 13, 2026), “Ted Lasso Season 4 Premiere Sets Ratings Record for Apple TV” — https://www.hollywoodreporter.com/tv/tv-news/ted-lasso-season-4-premiere-ratings-apple-tv-1236673077/

· TVLine, “Ted Lasso Season 4 Release Schedule” — https://www.tvline.com/2239636/ted-lasso-season-4-release-schedule-new-episodes-apple-tv/

· Axios Media Trends, “Streaming’s binge drop model fades as weekly releases return” — https://www.axios.com/media-trends-membership/2026/06/13/streaming-binge-weekly-release

· TheWrap (June 19, 2026; Christofer Hamilton / Parrot Analytics), “The Binge Is Back? New Data Shows the Real ROI for Streaming Release Windows | Charts” — https://www.thewrap.com/industry-news/business/streaming-binge-release-vs-weekly-demand-data/

· Parrot Analytics, “To Binge or not to Binge: Demand for Streaming Release Strategies” — https://www.parrotanalytics.com/insights/to-binge-or-not-to-binge-ott-release-strategies/

· Parrot Analytics, “The truth of binge vs. weekly release strategies” — https://www.parrotanalytics.com/academy/the-truth-of-binge-vs-weekly-release-strategies/

· Nielsen (Jan. 20, 2026), “Streaming Shatters Multiple Records in December 2025 with 47.5% of TV Viewing, according to Nielsen’s The Gauge” — https://www.nielsen.com/news-center/2026/streaming-shatters-multiple-records-in-december-2025-with-47-5-of-tv-viewing-according-to-nielsens-the-gauge/

· Nielsen (Feb. 17, 2026), “TV Viewing Hits 12-Month High in Nielsen’s January Report of The Gauge” — https://www.nielsen.com/news-center/2026/tv-viewing-hits-12-month-high-in-nielsens-january-report-of-the-gauge/

· Nielsen (July 28, 2026), “Streaming Embarks on Annual Summer Ascent in Nielsen’s May 2026 Gauge Reports” — https://www.nielsen.com/news-center/2026/streaming-embarks-on-annual-summer-ascent-in-nielsens-may-2026-gauge-reports/

· Forbes (Nov. 27, 2025), “Stranger Things Season 5 Release Schedule” — https://www.forbes.com/sites/monicamercuri/2025/11/27/stranger-things-season-5-release-schedule-when-do-new-episodes-come-out/

· Tom’s Guide, “Stranger Things season 5 release dates — three-part release” — https://tomsguide.com/entertainment/netflix/stranger-things-season-5-release-dates-get-ready-for-a-three-part-release-and-watch-the-new-trailer

· Antenna, “State of Subscriptions: Specialty SVOD Landscape 2026” (Jonathan Carson, Brendan Brady, Brooke Kilker) — report PDF; U.S. only, excludes free tiers, MVPD and telco distribution — https://www.antenna.live/

· Antenna, “Q1’26 State of Subscriptions Report: Premium SVOD 2025 Year in Review” — https://www.antenna.live/insights/antenna-q126-state-of-subscriptions-report-premium-svod-2025-year-in-review

· Media Play News, “Antenna: Specialty SVOD Services See 14% Sub Growth in 2026” — https://www.mediaplaynews.com/antenna-specialty-svod-services-see-14-percent-sub-growth-in-2026/

· The New York Times (Aug. 24, 2026) on bundling and gateways; via The Irish Times, Aug. 25, 2026 — https://www.irishtimes.com/business/2026/08/25/biggest-hitters-in-streaming-want-you-to-use-only-their-app/

· Collider, “Everything Officially Coming to Apple TV+ in Fall 2026” — https://collider.com/apple-tv-fall-2026-release-calendar/

· Deadline, “2026 TV Premiere Dates” — https://deadline.com/feature/2026-tv-premiere-dates-1236391902/

· Netflix Tudum (Aug. 18, 2026), “East of Eden” — https://www.netflix.com/tudum/articles/east-of-eden-series

· What’s on Netflix, “Every Big Returning Netflix Original Series Coming in Fall 2026” — https://www.whats-on-netflix.com/coming-soon/returning-netflix-original-series-late-2026/

· Variety, “A Different World Sequel Picked Up to Series at Netflix” — https://www.aol.com/entertainment/different-world-sequel-picked-series-183000872.html

· The Hankook Ilbo (한국일보), March 12, 2025 — https://www.hankookilbo.com/News/Read/A2025031016440002157

· Xportsnews (엑스포츠뉴스), March 10, 2025 — https://v.daum.net/v/Z9nEciQ0db

· CJ ENM (씨제이이엔엠) Q2 earnings coverage on TVING’s first operating profit — https://v.daum.net/v/y4abm30HSe

· Trailer: Ted Lasso — Season 4 Official Trailer (Trust the Process), Apple TV — https://www.youtube.com/watch?v=mZbJxpYHLuI

A note on attribution

Quotation marks indicate wording as reported by the cited outlet; unquoted passages summarize reporting. Material confirmed through a second outlet is identified as such.

Nielsen minutes are U.S. measurements, released by Apple and reported by the outlets cited. Currency conversions use 1 USD = 1,500 KRW.